
# Gold Price Today: Key Intraday Entry Levels for April 14
Active traders are watching gold price action on April 14 through a 5-minute bar chart for Comex gold futures, which highlights short-term technical support and resistance levels that can help identify potential intraday buy and sell entry points. For Indian investors tracking global bullion moves, these levels matter because shifts in Comex gold, XAUUSD, and the U.S. futures market often feed into domestic pricing for MCX gold and physical bullion.
What are the key gold price entry levels for April 14?
The main focus on April 14 is identifying potential buy and sell price entry levels in Comex gold futures using a 5-minute bar chart. The setup is designed for active intraday traders who need a fast technical read on short-term market direction.
According to the source analysis from Kitco News, the chart works as a practical trading and analytical tool for the active gold futures trader and market watcher. It maps short-term technical support and resistance levels, which traders use to spot areas where gold price momentum may strengthen or weaken during the session.
How does the 5-minute bar chart help gold traders?
The 5-minute bar chart helps by showing very short-term price behaviour in Comex gold futures. That makes it useful for traders who make decisions within the trading day rather than holding bullion positions for days or weeks.
Because intraday gold trading often depends on timing, a shorter chart interval can reveal quick changes in price momentum near support and resistance. In practical terms, the chart is intended to help traders judge when gold is showing early strength or early weakness.
Why do support and resistance levels matter in gold trading?
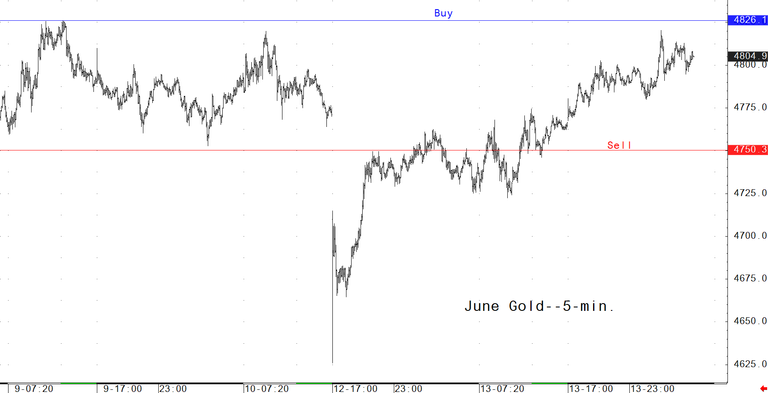
Support and resistance levels matter because they can act as decision zones for active traders. Support may indicate where buyers step in, while resistance may show where sellers become more aggressive.
In the context of gold price trading on April 14, these levels are being used to define potential entry points rather than long-term investment targets. That makes the tool especially relevant for traders focused on intraday bullion volatility.
What trading approach does the analysis suggest for active traders?
The analysis suggests that many successful traders buy on early price strength and sell on early price weakness. This is the core tactical message in the source article.
That approach reflects momentum-based trading rather than trying to catch every market turning point. For Comex gold futures traders, early confirmation of strength can reduce the risk of buying into a falling market, while early weakness can help identify more disciplined sell entries.
How can intraday gold traders apply this strategy?
Intraday gold traders can apply this strategy by watching how price behaves as it approaches the chart’s short-term support and resistance zones. If gold price starts to push higher with confirmation, traders may treat that as an early-strength signal.
If price starts to break lower or fails near resistance, traders may interpret that as early weakness. In fast-moving precious metals markets, execution discipline is often as important as the chart pattern itself.
Why should Indian investors track Comex gold futures?

Indian investors should track Comex gold futures because global price discovery in gold often begins in international markets before flowing into domestic prices. Moves in U.S. gold futures can influence MCX gold, wholesale bullion rates, and retail jewellery pricing in India.
For Indian market participants, the impact is usually filtered through both the international gold price per troy ounce and the USD/INR exchange rate. Even when the global bullion trend is steady, rupee moves can change the effective landed price of gold in India.
What does this mean for MCX and physical gold buyers in India?
It means intraday signals in Comex gold can offer an early clue for traders and dealers in India. If global gold futures show fresh strength or weakness on April 14, Indian traders may use that as a reference for short-term positioning in MCX gold.
Physical bullion buyers, jewellers, and high-frequency market watchers also monitor these shifts because they can affect same-day pricing. For investors, global futures action remains one of the clearest real-time indicators of broader safe-haven sentiment in precious metals.
Where did this gold market analysis come from?
The analysis came from Kitco News, which described the chart as a unique and exclusive daily trading and analytical tool for active intraday participants in the gold market. The source article specifically framed the 5-minute bar chart for Comex gold futures as valuable for traders and market watchers seeking short-term entry levels.
The article did not provide long-form macro analysis, price forecasts, or broader economic drivers. Instead, it focused tightly on the practical use of short-term chart-based buy and sell entry points for April 14.
For Indian investors, the key watchpoint now is whether intraday strength in global bullion can hold through the U.S. session and spill over into MCX gold pricing. If volatility picks up, traders will likely keep watching short-term support and resistance levels in XAUUSD and Comex futures for the next directional cue.


