
Spot gold held firm and spot silver rebounded sharply in late Monday trading as Strait of Hormuz risks kept oil prices, bond yields and inflation concerns in focus. For Indian investors, the move matters because any sustained rise in global gold price, crude oil and U.S. yields can quickly feed into domestic bullion rates and rupee-sensitive import costs.
Why did gold price hold steady today?
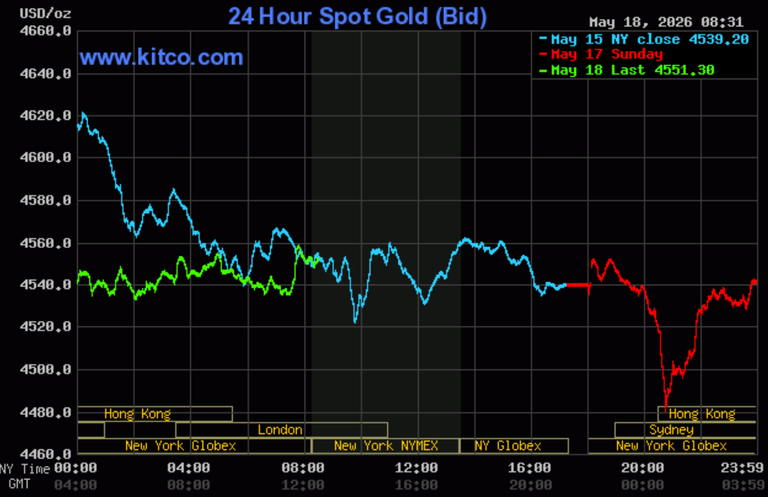
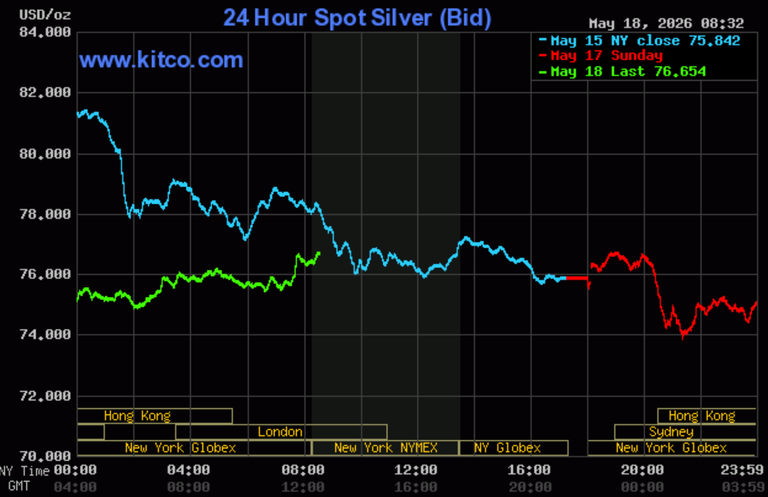
Gold price held steady because safe-haven demand from the U.S.-Iran conflict offset pressure from higher oil prices and elevated bond yields. At the time of writing, spot gold traded near $4,565.30 per troy ounce, up 0.57%, while spot silver traded at $77.480, up 2.16% on the session.
The market remained caught between two opposing forces. On one side, geopolitical stress supported demand for bullion and other precious metals. On the other, the oil shock lifted inflation expectations and rate concerns, which pushed yields higher and limited demand for non-yielding gold.
For XAUUSD, that meant buyers defended support levels, but the rebound still looked cautious rather than decisive.
What is happening in the Strait of Hormuz and why does it matter for gold?
The Strait of Hormuz matters for gold because its closure affects roughly one-fifth of global oil flows, making it a major cross-asset risk event. The U.S.-Iran conflict remained the dominant market driver on Monday, with every sign of escalation or negotiation moving oil, yields and safe-haven assets.
How did oil prices react?
Oil prices swung sharply through the session. Brent crude rose above $111 a barrel earlier in the day, then fell below $109 after President Donald Trump delayed a planned Iran strike at the request of Gulf allies.
In outside markets, Nymex WTI crude oil traded firmer near $101.79 a barrel. Brent crude stayed near the $109 to $111 area after touching $112.10 earlier in the session.
Why is the oil move a mixed signal for bullion?
The oil move is a mixed signal because Middle East tensions usually support safe-haven demand for gold, but higher energy prices also raise inflation and interest-rate expectations. That combination can lift real yields and reduce the appeal of non-yielding bullion.
For Indian investors, higher crude prices also matter beyond gold charts. India imports most of its oil, so a sustained energy spike can pressure inflation, the rupee and import costs, all of which can influence local gold prices in INR.
What are yields, the U.S. dollar and equities signaling for gold?
Yields are still the main headwind for gold, even though the U.S. dollar softened on Monday. The benchmark 10-year U.S. Treasury yield reached 4.63% before easing back to 4.59%, leaving gold vulnerable if yields climb again.
The U.S. dollar index was softer after last week’s rally, which gave gold some room to recover. Even so, the dollar remained broadly supported by safe-haven demand and rising rate-hike probabilities.
U.S. equities were mixed to lower as markets focused on oil and rate volatility. The S&P 500 ended down 0.1%, the Nasdaq fell 0.5%, and the Dow rose 0.3%.
The broader market picture suggests investors have not fully embraced a risk-off move into gold. Instead, markets are balancing safe-haven demand against the possibility that energy-led inflation could keep financial conditions tighter.
What did Fawad Razaqzada say about the gold price outlook?
Fawad Razaqzada said gold remains under pressure from oil, yields and the U.S. dollar despite Monday’s rebound. According to Fawad Razaqzada, market analyst at FOREX.com, gold remains “undermined as oil, yields and dollar apply pressure.”
His near-term view matched Monday’s trading pattern. Gold bounced from support, but the rebound did not yet show enough conviction to cancel out pressure from energy-driven inflation fears and higher real-rate assumptions.
That assessment is important for bullion traders because it suggests the current recovery in gold price may still be fragile unless yields cool or geopolitical stress intensifies further.
What are traders watching from the Federal Reserve?
Traders are watching the Federal Reserve’s April 28-29 meeting minutes, due Wednesday at 2 p.m. EDT, for signs that policymakers are becoming more concerned about energy-driven inflation. If the minutes show rising concern about inflation persistence, gold could face renewed pressure from higher yield expectations.
In the near term, the gold market remains tied to one central question: will the Iran risk premium show up mainly through safe-haven demand, or through a stagflation-style rates shock?
That distinction matters for Indian investors as well. If global yields rise faster than safe-haven flows, international gold may struggle even when geopolitical risk remains elevated.
What are the key technical levels for gold price today?
Gold bulls need a move back above the $4,660 to $4,680 resistance zone to strengthen the near-term outlook. A sustained break higher would target the 50-day moving average near $4,716 and then $4,800.
Bears, meanwhile, are focused on a break below $4,530. If spot gold falls through that level, the next downside targets sit at $4,350 to $4,370, followed by the 200-day moving average near $4,348.
Gold resistance and support levels
- First resistance: $4,585.20
- Second resistance: $4,660
- Bullish breakout zone: $4,660 to $4,680
- 50-day moving average target: $4,716
- Higher upside target: $4,800
- First support: $4,530
- Second support: $4,480.50
- Deeper downside zone: $4,350 to $4,370
- 200-day moving average: $4,348
What are the key technical levels for silver price today?
Silver bulls have regained momentum, but they still need a breakout above $78.00 to $79.00 to confirm stronger upside. Spot silver traded at $77.480, up 2.16%, showing much stronger intraday performance than gold.
If silver clears that resistance band, the next upside targets are $85.00 to $86.00 and then $89.00. On the downside, bears want a break below the 50-day moving average at $76.83, which would expose $75.00 and then $71.00 to $72.00.
Silver resistance and support levels
- First resistance: $78.00
- Second resistance: $79.00
- Bullish breakout zone: $78.00 to $79.00
- Next upside zone: $85.00 to $86.00
- Higher upside target: $89.00
- First support: $76.83
- Second support: $75.00
- Deeper downside zone: $71.00 to $72.00


