
# Gold Price Selloff Explained: Why March’s 12% Drop Wasn’t Fatal
Gold prices fell sharply in March, but the World Gold Council says the drop was driven mainly by deleveraging and liquidity stress during the Iran war shock rather than any collapse in gold’s core fundamentals. For Indian investors, that distinction matters: a liquidity-led selloff can reverse faster than a fundamentals-led bear market, especially when safe-haven demand, central-bank buying, and Asian dip-buying remain in the background.
According to the World Gold Council (WGC), gold fell 12% in March to US$4,608 per troy ounce, making it the weakest month for bullion since June 2013. Even so, gold remained higher for the year, and the WGC said the selling was more about forced liquidation than investors abandoning gold.
Why did gold prices fall in March?
Gold prices fell because investors needed liquidity and cut positions aggressively, not because gold suddenly lost its long-term appeal. The WGC said deleveraging, ETF outflows, COMEX long unwinding, and trend-following selling drove most of the decline.
“Gold fell 12% in March to US$4,608/oz, its weakest month since June 2013,” WGC analysts wrote in their latest market commentary. They added that gold lost value in all major currencies, although it still remained up for the year.
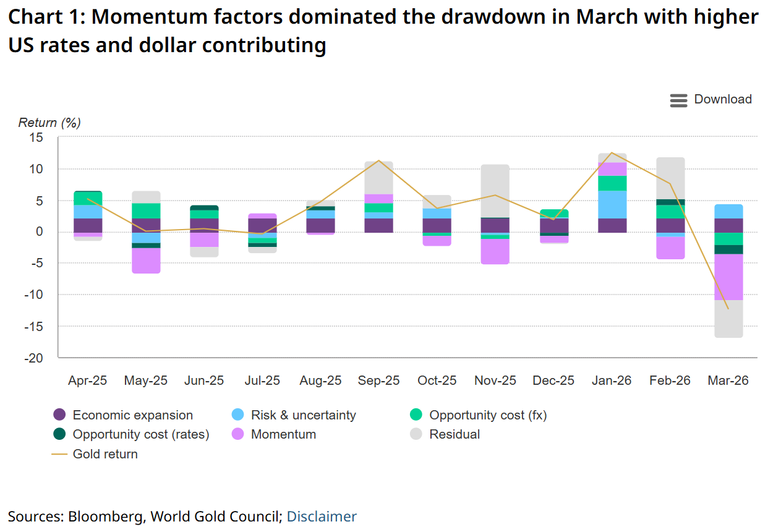
The WGC’s monthly attribution model, GRAM, captured the bearish sentiment but not the full scale of the move. The model attributed much of the drop to momentum factors, including:
- global gold ETF outflows
- a COMEX net long unwind
- a price trend reversal
- smaller pressure from a stronger US dollar
- lesser contribution from higher yields
What does the World Gold Council say really caused the selloff?
The World Gold Council says the March gold selloff was caused by deleveraging and liquidity dynamics rather than changing fundamentals. In simple terms, investors sold what they could sell, not necessarily what they wanted to exit.
“Gold’s sell‑off during the first three weeks of March was sharp, counter‑intuitive, but not unprecedented,” the analysts said. They noted that the decline happened despite a backdrop that would usually support safe-haven assets such as gold, including elevated geopolitical tensions and renewed inflation concerns.
The WGC made a key point for investors: gold is not a contractual hedge. Gold prices rise only when new buyers outnumber sellers. In March, liquidity needs and deleveraging tipped that balance in favor of sellers.
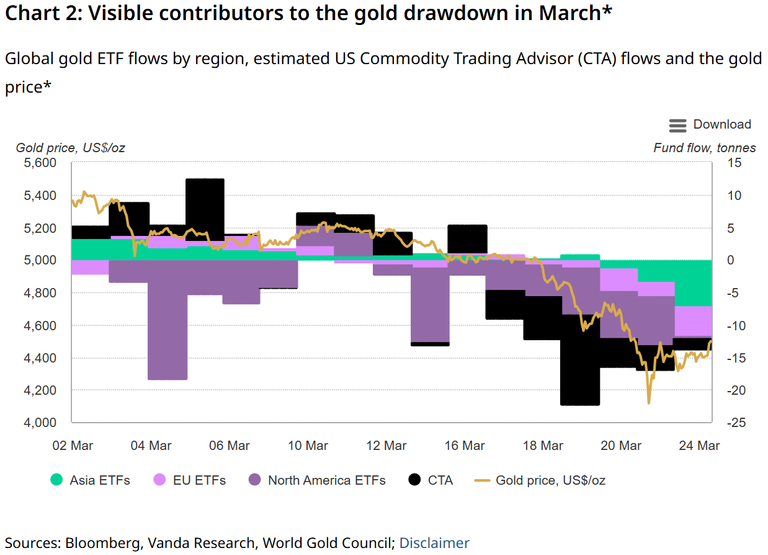
Over the three weeks to 24 March, the WGC said gold appeared to overreact to a conflict-led rise in US real yields. The US dollar also strengthened, but only modestly. The weekly GRAM model reflected the stress with a 12% cumulative negative residual over that period, suggesting that variables beyond yields and the dollar played a major role.
How did ETF outflows and COMEX positioning pressure gold?
ETF outflows and COMEX long liquidation put direct pressure on gold prices by removing investment demand and accelerating bearish momentum. The heaviest selling came from North America and, to a much smaller extent, Europe.
The WGC said global gold ETFs saw US$12 billion in outflows in March, equal to 84 tonnes of gold. But those outflows were not evenly spread across regions:
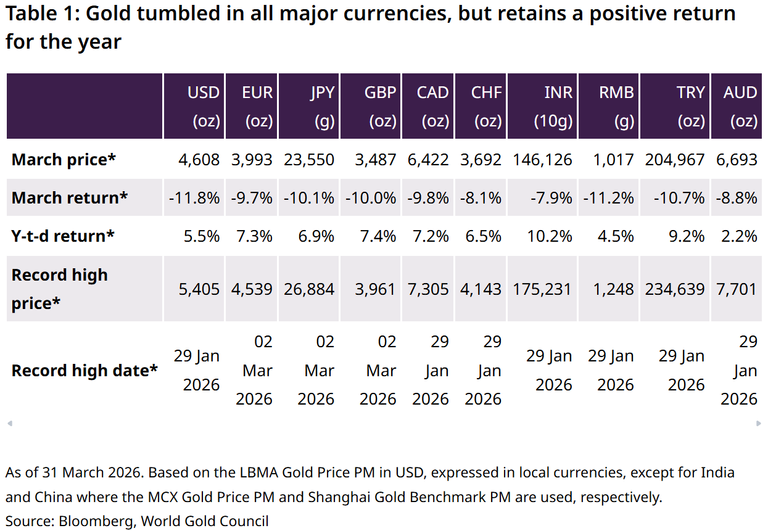
- North America: US$14 billion outflow, or -87 tonnes
- Europe: US$0.1 billion outflow, or -7 tonnes
- Asia: US$1.9 billion inflow, or 10 tonnes
On futures positioning, COMEX managed money net long positions dropped US$2 billion, equal to 19 tonnes, in March. Even after that reduction, the WGC said speculative positioning still retained a solid long bias.
What happened with retail and institutional positioning?
Retail and institutional traders both cut exposure, adding to the gold price decline. The WGC said a buildup in retail exposure left the market vulnerable to a flush-out.
During the first three weeks of March, COMEX Non-Reportable positions, often associated with retail activity, saw a cumulative 18-tonne net drop. That occurred alongside a 22-tonne drop in Managed Money, which is more closely tied to institutional investors.
The WGC also said some gold ETF selling likely came from retail investors. Between the beginning of March and 24 March, global gold ETFs lost a net 80 tonnes, with the United States accounting for the bulk of those outflows.
How did CTA selling and deleveraging make the drop worse?
CTA selling and cross-asset deleveraging likely amplified gold’s decline after key technical levels broke. Once gold slipped below closely watched moving averages, systematic and multi-asset investors appear to have accelerated liquidation.
The WGC said Commodity Trading Advisors (CTAs) were estimated and anecdotally reported to be very long heading into mid-March. They then reportedly unwound positions sharply after gold broke through its 50/55-day moving average on 16 March for the first time in seven months.
That technical break likely intensified downside momentum in XAUUSD.
How did wider market stress spill into bullion?
Broader market stress spilled into bullion because investors across asset classes were trying to raise cash and reduce risk. Gold was sold as part of portfolio-wide deleveraging, even though its longer-term role as a safe-haven asset did not disappear.
The WGC pointed to elevated margin debt relative to market capitalisation as a factor behind widespread equity selling. It noted that all but one sector in the S&P 500, energy, posted declines.
In that environment, gold was not spared. According to the WGC, multi-asset investors, including CTAs with equity exposure, likely sold gold to meet liquidity needs and reduce portfolio value-at-risk, or VaR.
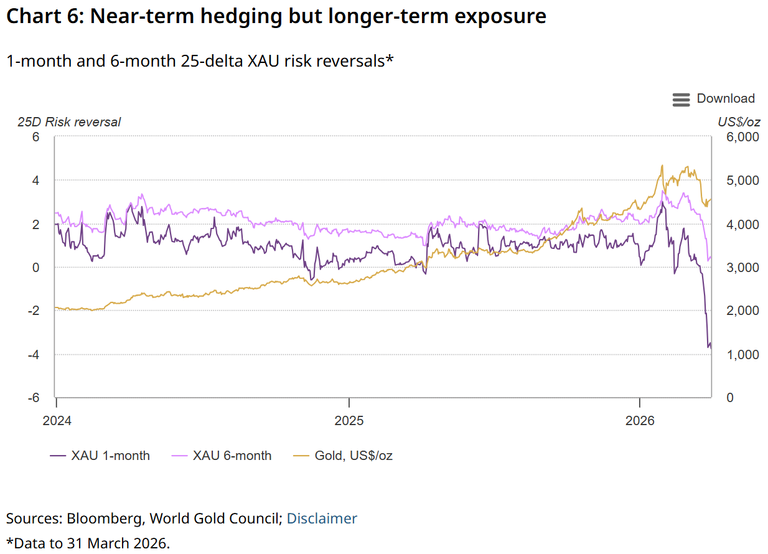
What role did US yields and the bond market play?
US yields added pressure to gold, but they were not the only driver. The WGC said bonds sold off on a near-term inflation shock, lifting short-dated yields and inflation expectations.
Specifically, the World Gold Council said US bonds were sold on a near-term inflation shock, with 2-year nominal yields and the breakeven rate rising sharply. Higher real and nominal yields generally hurt non-yielding assets like gold because they raise the opportunity cost of holding bullion.
Still, the WGC’s analysis suggests yields alone do not explain a 12% monthly fall. The deeper issue was forced selling layered on top of a yield shock.
Did central banks contribute to the gold price decline?
Yes, central-bank-related liquidity moves may have contributed to market rumors and short-term pressure, but the WGC said this did not reflect a strategic retreat from gold. The key case involved Türkiye’s central bank using gold as collateral.
The WGC said The Central Bank of the Republic of Türkiye (CBRT) used approximately 50 tonnes of gold as collateral, mainly via swaps. That move may have fueled rumors of outright gold selling.
The analysts stressed that there was precedent for this kind of activity, including during the 2023 earthquake and during COVID. They argued that Turkey’s action should be seen as a liquidity response during market turbulence, not as a change in reserve strategy.
The WGC went further and said the move actually reinforced why gold remains indispensable as a reserve asset. When stress rises, central banks can mobilize bullion to secure liquidity.
The analysts added that US Federal Reserve data suggested central banks were also increasing outright sales of US Treasuries at the same time to buffer against higher energy-price risk. In the WGC’s view, that supports the conclusion that the pressure was liquidity-driven rather than a sign of fading official-sector confidence in gold.
Did Middle East disruptions move global gold prices?
No, the World Gold Council said disruptions to Middle East gold flows likely had little material impact on global gold prices. Local demand and trading conditions changed, but not enough to move the international bullion market.
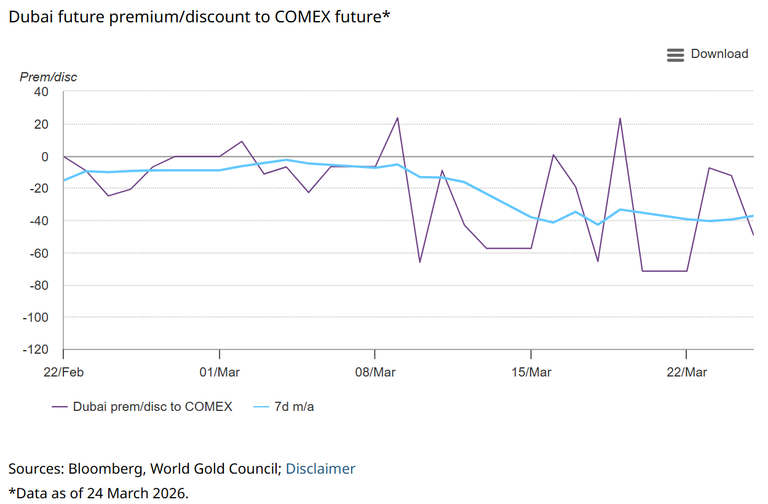
The WGC said travel disruptions and lower tourist footfall weighed on demand for jewellery and small bars, especially from foreign buyers. Local gold prices also moved into a deeper discount to COMEX, though the adjustment was described as modest.
Trading volumes in Dubai increased during the period, but the WGC said they remained at levels insufficient to influence international prices.
That is an important distinction for investors following geopolitical headlines. A regional disruption can affect local premiums, retail demand, and logistics without necessarily changing the global XAUUSD price trend.
What does this mean for Indian gold investors?
For Indian investors, the March gold price selloff suggests that global bullion weakness was driven more by financial-market stress than by a breakdown in physical or strategic demand. That means any correction in international prices could create buying opportunities, especially if Asian demand remains firm and the rupee does not weaken sharply.
The WGC highlighted Asia’s US$1.9 billion inflows, equal to 10 tonnes, as a positive sign. That matters in India because Indian bullion demand often strengthens on dips, particularly when consumers, jewellers, and long-term savers view lower prices as an entry point.
Indian investors should also watch the USD/INR exchange rate closely. Even if international gold prices in US dollars fall, a weaker rupee can cushion or even offset the decline in domestic gold rates. In practice, that means MCX gold and retail bullion prices in India may not mirror every fall in global spot gold one-for-one.
Why the India angle matters now
India is one of the world’s largest gold-consuming markets, so Asian buying trends are highly relevant. If Western ETF selling slows while Asian physical and fund demand improves, gold price support can rebuild faster than many traders expect.
For Indian households and investors, the key takeaway is not just the fall to US$4,608 per ounce. It is that the WGC does not see the March slump as evidence that gold’s strategic case has broken.
Are there signs that gold can recover from here?
Yes, the World Gold Council said there are “green shoots” for a resumption of gold’s positive trend, although short-term risks remain. The balance now depends on whether deleveraging fades and whether central-bank gold mobilization triggers further market anxiety.
The WGC’s postmortem concluded that deleveraging and liquidity dynamics rather than shifting fundamentals led the March sell-off. That assessment leaves room for recovery if forced liquidation eases.
But the council also warned about near-term risks, including:
- further deleveraging across markets
- central-bank gold mobilization
- ongoing sensitivity to US yields and inflation shocks


