What caused the late-January gold and silver selloff?
The Bank for International Settlements said retail traders using leveraged ETFs were a major force behind the sharp late-January selloff in gold and silver. According to the BIS Quarterly Review, heavy retail inflows, daily leveraged ETF rebalancing, and margin-driven liquidations turned a reversal into an outsized crash.
Egemen Eren, Ingomar Krohn and Karamfil Todorov wrote that precious metals prices reversed abruptly in late January and February 2026 after a prolonged rally through 2025 and into early 2026. They said retail-driven exuberance, increasingly channelled through exchange-traded funds, set the stage for extreme moves and extended a trend already visible in 2025.
The BIS authors said the late-January crash appeared to coincide with changes in expectations for the US dollar and the path of monetary policy. But they added that the scale of the move was difficult to explain through broader fundamentals alone.
For Indian investors, that distinction matters. When global gold price action in XAUUSD becomes driven more by leverage and forced selling than by physical demand or macro fundamentals, volatility can spill into domestic bullion prices even if underlying jewellery and investment demand in India stays steady.
How big was the move in gold and silver prices?
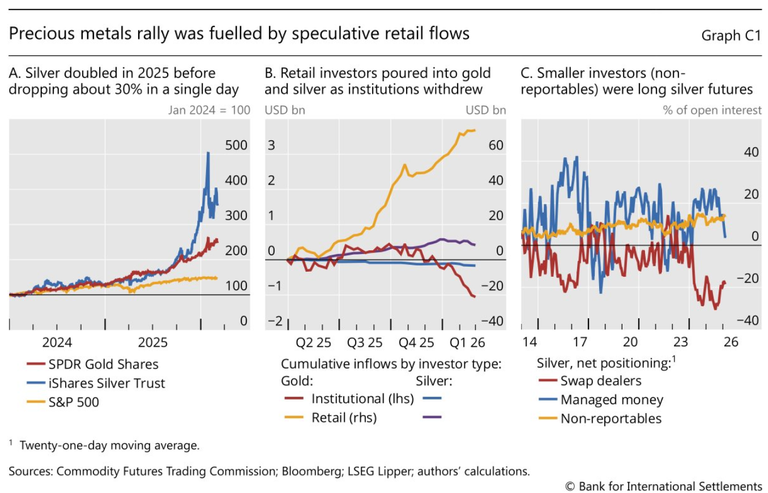
The selloff was severe, especially in silver. BIS said silver had doubled over 2025 and then rose by more than 50% in January 2026 before collapsing by about 30% in a single day in late January.
Gold followed a similar pattern, but the move was less extreme than silver. The BIS did not cite a one-day percentage drop for gold in the excerpt, but said gold broadly tracked the same boom-and-reversal structure as precious metals prices surged to record highs and then dropped abruptly in late January and February 2026.
Why was silver hit harder than gold?
Silver was more exposed to leveraged positioning and ETF-related feedback loops. BIS said the amplification mechanics were particularly strong in silver, where retail participation and leveraged ETF activity played a bigger role.
That matters for precious metals investors in India because silver often shows higher volatility than gold, and sharp global silver moves can quickly affect domestic silver rates. Gold usually remains the more stable safe-haven asset, but this episode shows that even gold can face abrupt downside pressure when leverage builds across bullion markets.
Why did BIS blame retail traders more than institutions?
BIS said fund flow data showed retail investors, not major institutions, were the main source of inflows into gold and silver funds before the selloff. Institutional investors, by contrast, either held positions steady or trimmed exposure.
The BIS authors also pointed to futures data. They said smaller speculative investors, classified as "non-reportables," were disproportionately long silver futures heading into the correction.
What did futures positioning show?
The futures data suggested small speculative traders were heavily exposed on the long side before prices fell. As the correction intensified and exchanges raised margin requirements, these smaller investors likely had to cut positions quickly.
BIS said "managed money," including commodity trading advisers and institutional investors, also reduced long positions during the decline. Dealers then stepped in to provide liquidity by cutting short positions.
That sequence helps explain why a market that looked strong on the way up turned disorderly on the way down. Once leveraged traders started selling, more participants were forced to respond.
How did leveraged ETFs amplify the gold and silver crash?
Leveraged ETFs amplified the selloff because they must rebalance every day to maintain fixed daily leverage. BIS said this process creates predictable momentum-like trading that can strengthen existing price trends.
When precious metals prices rise, leveraged ETFs buy the underlying exposure, often through futures, to restore target leverage. When prices fall, they must sell that exposure. That means leveraged ETF flows can add buying in a rally and add selling in a decline.
Why do daily rebalancing flows matter?
Daily rebalancing matters because it can create a feedback loop. BIS said this trading pattern reinforces prevailing trends and can distort prices in both directions.
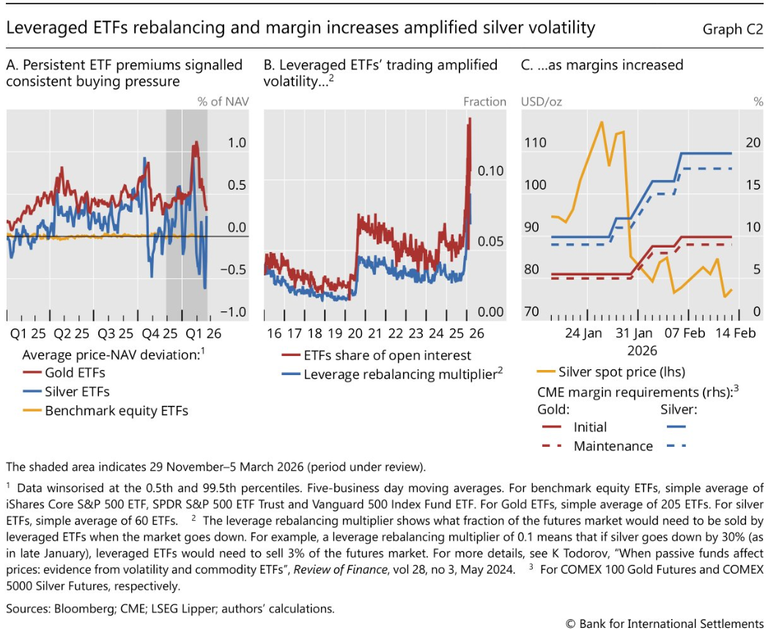
The authors used a specific measure called the leverage rebalancing multiplier to track this effect. They said the multiplier doubled over the course of 2025, showing that the market impact of leveraged ETF daily rebalancing flows had risen sharply.
How large did the ETF footprint become?
BIS said the share of ETFs in the market followed similar dynamics as the rebalancing multiplier during 2025. That indicated ETF activity had become a larger part of the precious metals market and had intensified price trends.
The authors also highlighted persistent premiums in gold and silver ETFs over net asset value, or NAV, before the reversal. According to BIS, these sustained premia signalled strong one-sided buying pressure that exceeded the ability of authorised participants to create new shares and deliver physical metal to bring ETF prices back toward NAV.
As prices reversed in late January, those ETF premia compressed rapidly. In silver, they even turned into pronounced discounts, which BIS said was consistent with one-sided selling pressure and a sudden reversal in flows.
For Indian investors, this is a useful warning sign. If ETF premiums, leveraged products, and speculative futures flows start driving gold price action more than physical bullion demand, volatility in international markets can rise faster than expected and affect imported gold costs in rupees.
How did margin calls worsen the precious metals rout?
Margin calls worsened the selloff by forcing leveraged traders to cut positions into a falling market. BIS said rapid price declines increased variation margins on futures positions, while several exchanges also tightened initial margin requirements during the episode.
That combination created funding pressure. Investors most exposed to the decline had to deleverage quickly, which added fresh selling to an already weak market.
What self-reinforcing loop did BIS identify?
BIS said the market entered a self-reinforcing loop of lower prices and further margin calls. Forced liquidations by investors, combined with systematic selling from leveraged ETF rebalancing, likely pushed prices down further.
The authors compared the pattern to past stress episodes. In their view, falling prices triggered higher margin demands, which triggered more deleveraging, which then caused even lower prices.
That mechanism is important for gold investors in India because global bullion prices are not always falling due to weaker physical demand or a change in long-term safe-haven appeal. Sometimes gold price declines happen because leveraged market structure breaks down temporarily.
What does the BIS report mean for the gold price outlook in India?
The BIS report suggests that leverage and market structure can move gold prices sharply even when broader fundamentals do not fully justify the scale of the decline. For Indian investors, that means short-term price shocks in XAUUSD can feed into local bullion markets, especially through import pricing and INR exchange-rate effects.
If the rupee weakens against the US dollar while international gold prices fall, domestic gold prices may not decline as much as global headline moves suggest. If the rupee strengthens, Indian buyers may see more of the international downside passed through into local rates.
What should Indian investors watch next?
Indian investors should watch ETF premiums or discounts, futures positioning, margin requirement changes, and signs of excessive retail leverage in gold and silver products. These indicators can reveal whether bullion is trading on fundamentals such as inflation, Federal Reserve policy and safe-haven demand, or on unstable leverage dynamics.
The key watchpoint now is whether precious metals markets return to more balanced positioning after the late-January and February 2026 turmoil. If speculative leverage rebuilds quickly, gold and silver could remain vulnerable to another sharp swing even if the longer-term case for bullion stays intact.


