
# Bitcoin Price Uptrend Builds After 2.5-Month High
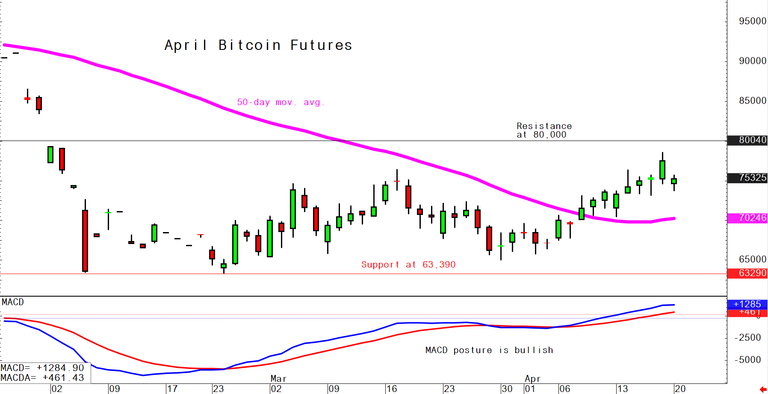
April bitcoin futures edged higher in early U.S. trading on Monday, April 20, after touching a 2.5-month high on Friday. The daily chart shows bulls still holding momentum, with price action continuing to work within a developing uptrend.
For Indian investors tracking global risk assets alongside gold price trends, the move matters because strength in bitcoin can influence broader safe-haven and speculative flows across bullion, precious metals, and alternative assets.
What happened to bitcoin prices on April 20?
April bitcoin futures rose modestly in early U.S. trading on Monday, April 20. The gain followed Friday’s move to a 2.5-month high, signalling that buyers remained active after the recent breakout.
The source article did not provide a last traded price, percentage gain, or intraday high-low range. However, the key market signal was clear: bitcoin held firm after reaching its strongest level in two and a half months.
What does the daily chart say about the bitcoin trend?
The daily chart points to a developing uptrend. According to the Kitco News chart alert, bulls are still working on a price uptrend on the daily bar chart, which indicates improving short-term technical structure.
In technical analysis, an uptrend forms when buyers keep defending pullbacks and prices build a pattern of firmer closes. That appears to be the current setup in April bitcoin futures, even if the advantage remains only modest rather than decisive.
Why is chart momentum important?
Momentum matters because it shows whether buyers can sustain control after a rally. In this case, bitcoin’s push to a 2.5-month high on Friday and follow-through buying on Monday suggest that bullish sentiment has not faded immediately.
For traders, that can support further upside attempts if resistance levels give way. For longer-term investors, it signals improving market tone, though not yet an overwhelmingly bullish breakout.
Who has the near-term technical advantage in bitcoin?
Bulls have the slight near-term technical advantage. The source article states that bulls still have some momentum and retain the slight overall near-term edge.
That wording is important. It does not suggest a dominant bull market signal. Instead, it indicates a balanced market that has tilted in favour of buyers for now.
What does Wyckoff’s Market Rating of 5.5 mean?
Wyckoff’s Market Rating of 5.5 out of 10.0 indicates a mild bullish bias. On the scale cited in the source, 1.0 is the most bearish and 10.0 is the most bullish.
A 5.5 reading sits only slightly above neutral. That means bitcoin bulls have an edge, but they still need stronger price action to confirm a more convincing upside trend.
What support and resistance levels should traders watch?
The key takeaway is that support and resistance lines remain the most important technical markers to monitor. The source article specifically notes that traders should watch the important technical support and resistance lines on the chart.
The article did not publish the exact levels in text. Even so, the message is straightforward: bitcoin’s next directional move will likely depend on whether bulls can push through resistance or whether sellers force prices back toward support.
How do support and resistance affect trading decisions?

Support is the price zone where buying interest tends to emerge, while resistance is the area where selling pressure often increases. If bitcoin holds above support, the current uptrend can remain intact.
If bitcoin breaks above resistance, bulls may gain stronger control. If prices fall below support, the near-term technical advantage could shift back to bears.
Why should Indian investors care about bitcoin moves on GoldPrice India?
Indian investors should care because bitcoin strength can affect sentiment across global markets, including gold, bullion, and other precious metals. When traders embrace risk assets such as bitcoin, some capital can rotate away from traditional safe-haven assets like gold.
At the same time, bitcoin and gold often attract different types of buyers in India. Gold remains a core store of value tied to jewellery demand, central bank buying, inflation hedging, and rupee weakness, while bitcoin is more sensitive to global risk appetite and speculative flows.
How can bitcoin strength influence gold in India?
A rising bitcoin price does not automatically push gold lower, but it can shape investor mood. If global investors move toward higher-risk assets, XAUUSD and other precious metals may lose some short-term safe-haven demand.
For Indian investors, the final impact also depends on the rupee-dollar exchange rate. Even if international bullion prices soften, INR depreciation can keep domestic gold prices firm.
What should Indian market participants watch next?
Indian investors should watch whether bitcoin can extend beyond Friday’s 2.5-month high and whether the daily uptrend remains intact. They should also compare moves in bitcoin with the gold price, U.S. dollar direction, and broader risk sentiment.
If bitcoin continues to strengthen while gold consolidates, that may reflect a wider shift toward risk-taking in global markets. If both bitcoin and gold rise together, investors may be responding to macro uncertainty in different ways.
For now, the key watchpoint is simple: April bitcoin futures remain slightly bullish on the charts, with bulls holding a narrow technical advantage and Wyckoff’s Market Rating at 5.5 out of 10.0 on Monday, April 20.


