
# Bitcoin Price Trend Favors Bulls Near 2.5-Month High
April bitcoin futures traded higher in early U.S. trading on Wednesday, April 22, and stayed close to a recent 2.5-month high. The daily chart signals that bulls hold the near-term technical edge, with the price uptrend still intact.
For Indian investors, the move matters because global crypto sentiment often spills over into broader risk assets, including gold, silver, and other precious metals. While bitcoin is not bullion, shifts in risk appetite can influence safe-haven demand, portfolio allocation, and rupee-based investor positioning.
What Happened to Bitcoin Prices on April 22?
April bitcoin futures moved higher in early U.S. trading on Wednesday, April 22. Prices remained near the recent 2.5-month high, showing that bullish momentum had not faded.
That price action suggests buyers are still active at elevated levels. When futures trade near a multi-month high, traders usually read it as a sign that demand remains firm unless a sharp reversal appears.
Why Does the Daily Chart Still Favor Bitcoin Bulls?
The daily bar chart still favors bulls because the uptrend remains in place. As long as that upward trend holds, buyers keep the overall near-term technical advantage.
Kitco’s chart-based reading was straightforward: the price trend is the bulls’ friend. In technical analysis, a sustained uptrend often attracts additional momentum buying, especially when prices stay close to recent highs.
What Does the Near-Term Technical Advantage Mean?
The near-term technical advantage means bitcoin bulls currently control the short-term market structure. That does not guarantee immediate gains, but it does show that buyers have stronger chart momentum than sellers right now.
The article specifically noted that bulls have the overall near-term technical advantage. This matters because technical traders often use trend direction, support, and resistance to decide entries and exits.
What Is Bitcoin’s Wyckoff Market Rating Right Now?
Bitcoin’s Wyckoff Market Rating was 6.0 out of 10.0 on April 22. That score indicates a moderately bullish technical backdrop rather than an extreme breakout condition.
On the Wyckoff scale, 1.0 is the most bearish and 10.0 is the most bullish. A 6.0 reading shows the market leans positive, but it is not yet in the strongest possible bullish zone.
How Should Traders Read a 6.0 Wyckoff Rating?

A 6.0 rating signals that bulls hold an advantage, but the setup is not one-sided. Traders would usually treat that as constructive price action while still watching for confirmation from support and resistance levels.
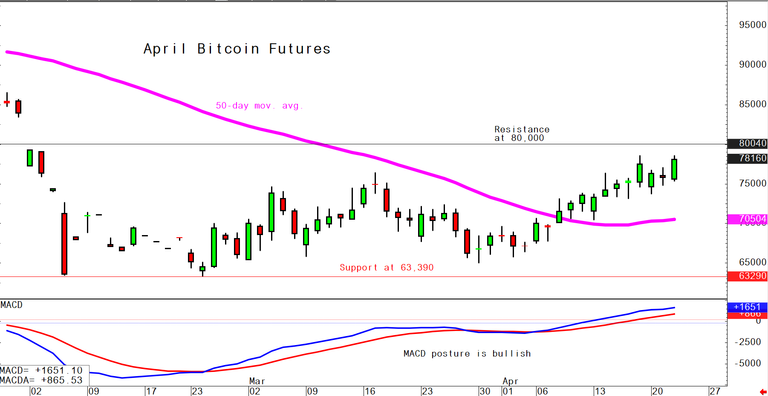
The source article also pointed readers to the chart’s important technical support and resistance lines. Those levels are critical because a break above resistance can strengthen bullish momentum, while a drop below support can weaken the trend.
What Support and Resistance Levels Should Traders Watch?
The source article said traders should watch the important technical support and resistance lines on the chart. It did not publish the exact price levels in the text provided, but it made clear that those chart markers are central to the next directional move.
In practical terms, support is the zone where buyers may step in, while resistance is the zone where selling pressure may emerge. For bitcoin futures, a hold above support would keep the bullish structure alive, while a decisive move above resistance could extend the uptrend from the recent 2.5-month high.
How Does This Matter for Indian Investors Tracking Gold and Risk Assets?
The bitcoin rally matters for Indian investors because stronger crypto prices can reflect broader risk-on sentiment across global markets. When investors embrace risk assets, gold price momentum in XAUUSD can sometimes cool in the short term as capital shifts away from safe-haven trades.
That said, gold and bitcoin do not always move in opposite directions. Indian investors should track the U.S. dollar, Treasury yields, and INR movements alongside bitcoin and bullion prices, because rupee depreciation can still support domestic gold prices even when global risk appetite improves.
For investors in India, this is more about cross-asset signals than direct substitution. A firm bitcoin market near a 2.5-month high may indicate rising speculative confidence, while gold, silver, and other precious metals continue to respond to inflation, central-bank policy, and safe-haven demand.
The key watchpoint now is whether April bitcoin futures can break cleanly above their recent 2.5-month high while maintaining the daily uptrend. If that trend weakens or support fails, market leadership could shift quickly, with wider implications for global risk sentiment and Indian allocation decisions across crypto, bullion, and precious metals.


