
# Bitcoin Price Outlook: Bulls Hold Technical Edge on April 23
April bitcoin futures were weaker in early U.S. trading on Thursday, April 23, but the broader chart pattern still favored buyers. The pullback looked corrective rather than trend-breaking, and Wyckoff’s Market Rating stood at 6.0 out of 10.0, signaling a modest bullish near-term technical bias.
For Indian investors, bitcoin’s technical setup matters beyond crypto alone. It can influence risk appetite across global markets, including gold, silver, bullion-related ETFs, and other safe-haven trades when capital rotates between speculative and defensive assets.
Why Did Bitcoin Prices Slip on April 23?
Bitcoin prices slipped because traders took profits after recent gains. In early U.S. trading on Thursday, April 23, April bitcoin futures moved lower in what Kitco described as a routine corrective pullback.
That wording is important. A corrective pullback usually means the market is retracing after an advance, not necessarily reversing into a fresh downtrend. In technical terms, the market was easing within an existing uptrend on the daily bar chart.
What Does the Daily Chart Say About Bitcoin’s Trend?
The daily chart showed that bulls still had the near-term advantage. Despite the early-session weakness on April 23, the price uptrend remained in place.
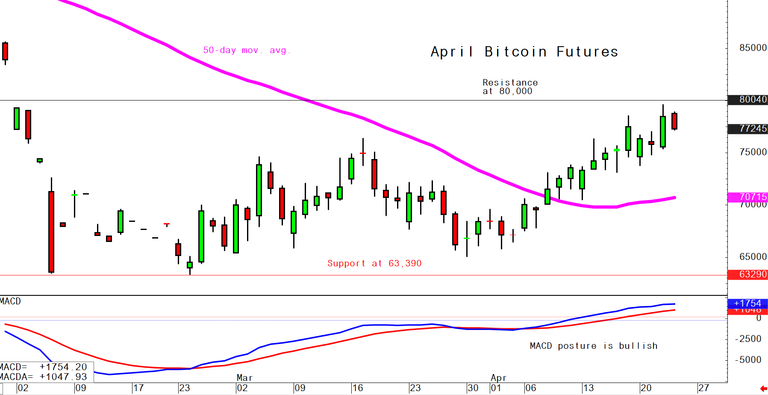
Kitco’s assessment was clear: “the price trend is their friend.” That means momentum and chart structure continued to support buyers, even as the market paused after recent gains.
How Strong Was the Bullish Bias?
The bullish bias was moderate, not extreme. Wyckoff’s Market Rating came in at 6.0 out of 10.0.
On that scale, 1.0 is the most bearish and 10.0 is the most bullish. A 6.0 reading suggests bulls hold the technical edge, but the market is not in a runaway euphoric phase.
What Is Wyckoff’s Market Rating of 6.0 Signaling?
A Wyckoff rating of 6.0 signals that bitcoin’s near-term technical backdrop remains positive. It suggests buyers have better control than sellers, but resistance levels still matter and pullbacks can continue.
For active traders, that type of reading often points to a market where buying interest remains intact on dips. However, traders still need to watch support and resistance lines closely, especially in futures markets where volatility can accelerate quickly.
How Could Bitcoin’s Technical Setup Matter for Gold Investors in India?

Bitcoin’s technical strength can affect gold indirectly by shaping global risk sentiment. When traders prefer high-beta assets like bitcoin, some flows can move away from safe-haven assets such as gold and other precious metals.
For Indian investors, that matters because international moves in risk appetite can affect the gold price, XAUUSD positioning, and domestic bullion rates once converted into INR. If bitcoin stays firm while the U.S. dollar and yields also rise, gold can face competing pressures.
Why Should Indian Investors Track Cross-Asset Signals?
Indian investors should track cross-asset signals because crypto, gold, and the U.S. dollar often compete for capital in uncertain markets. A stronger speculative mood can reduce immediate safe-haven demand for bullion, while a broader risk-off move can revive interest in gold priced per troy ounce globally and per gram in India.
This does not mean bitcoin and gold always move in opposite directions. But in short-term trading, shifts in sentiment can influence both XAUUSD and crypto positioning.
What Should Traders Watch Next in Bitcoin?
Traders should watch whether the current dip stays a normal correction or turns into a deeper break in trend. The key issue after April 23 is whether bulls continue to defend chart support and preserve the daily uptrend.
Kitco noted that traders should monitor the important technical support and resistance lines on the chart. If support holds, the bullish structure remains intact. If resistance breaks higher after the pullback, bulls could strengthen their control further.
For Indian market participants, the next watchpoint is whether crypto resilience spills over into broader risk assets or whether renewed volatility pushes investors back toward gold, bullion, and other precious metals. That cross-market shift could shape both international prices in U.S. dollars per troy ounce and local gold pricing in INR.


