
# Bitcoin Price Hits 2.5-Month High as Bulls Gain Momentum
Bitcoin price rose to a 2.5-month high in early U.S. trading on Friday, April 17, as bullish momentum strengthened in futures markets. For Indian investors tracking cross-asset sentiment, the move matters because sharp gains in Bitcoin can influence risk appetite across gold, bullion, and other precious metals markets.
Why Did Bitcoin Price Rise on April 17?
Bitcoin price rose because bulls kept control of the near-term trend and pushed April bitcoin futures higher in early U.S. trading on Friday, April 17. The move lifted prices to their highest level in 2.5 months.
The source report from Kitco News said April bitcoin futures were firmer on the day. That strength suggests buyers remained active and continued to build upside momentum.
In market terms, a 2.5-month high often signals improving sentiment. It can also attract fresh speculative interest from traders who follow breakout patterns in highly liquid risk assets.
What Does the Daily Chart Say About Bitcoin Momentum?
The daily chart shows that bulls are working on a price uptrend. That means the short-term technical structure has improved, even if the broader trend still needs confirmation.
Kitco News noted that bulls have momentum on the daily bar chart. In technical analysis, that usually means buyers have started to defend dips while also pushing resistance levels higher.
Wyckoff’s Market Rating came in at 5.5 out of 10.0. That reading gives bulls a slight overall near-term technical advantage, but it does not yet indicate a fully dominant bullish market.
How bullish is a Wyckoff rating of 5.5?
A Wyckoff Market Rating of 5.5 is modestly bullish. On the scale cited in the report, 1.0 is the most bearish and 10.0 is the most bullish.
That places Bitcoin just above neutral territory. In practice, it means traders see improving conditions, but they still want stronger confirmation through sustained upside follow-through.
Could the Recent Sideways Trading Be a Bullish Signal?
Yes, the recent sideways and choppy trading at lower levels could be a bullish signal if it proves to be a base-building phase. The report described this action as possible “basing” or “coiling” behavior.
In technical terms, basing happens when prices stop falling and begin moving sideways as selling pressure fades. Coiling refers to a tight trading range that can precede a larger directional move.
If that interpretation is correct, Bitcoin may be preparing for a bigger price uptrend. Traders often watch such patterns closely because breakouts from consolidation zones can be sharp and fast.
Why does coiling matter to traders?
Coiling matters because compressed price action often leads to stronger volatility once the market breaks out. When buyers hold the range despite earlier weakness, that can signal accumulation.
For momentum traders, that setup becomes more important when it appears alongside a fresh multi-month high. That is exactly why the April 17 move stands out.
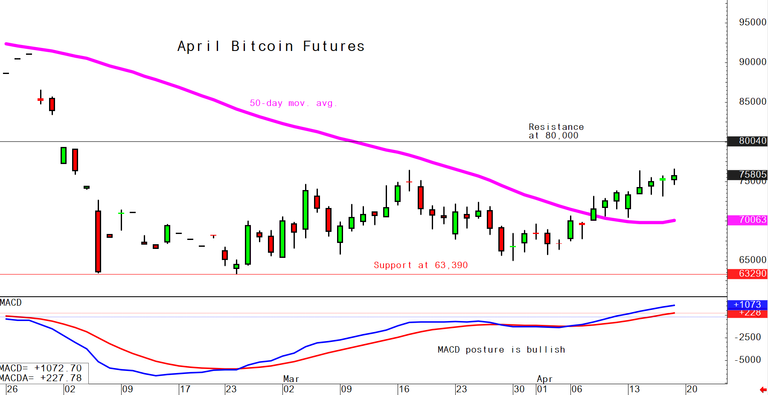
What Are the Key Technical Levels Traders Are Watching?
The key technical focus remains support and resistance lines on the chart. The source article specifically highlighted those levels as important for near-term direction, although it did not publish exact price points in the text provided.

Resistance levels help show where Bitcoin price may face selling pressure. Support levels indicate where buyers may return if the market pulls back.
Because bulls now hold a slight near-term technical advantage, traders will likely watch whether Bitcoin can stay above support after reaching the 2.5-month high. A successful hold could strengthen the bullish case.
How Does Bitcoin Strength Matter for Indian Investors?
Bitcoin strength matters for Indian investors because it reflects broader global risk sentiment that can spill over into gold price trends, currency positioning, and portfolio allocation decisions. When investors embrace higher-risk assets like Bitcoin, some safe-haven demand for gold can soften in the short term.
At the same time, Indian investors should not treat Bitcoin and gold as direct substitutes. Gold remains a traditional safe-haven asset, deeply linked to inflation hedging, central bank demand, jewellery demand, and rupee-dollar moves.
What is the India market angle?
For Indian investors, any global surge in Bitcoin can affect capital flows and sentiment, but domestic gold prices also depend on INR movement against the U.S. dollar, import duties, and local demand. If risk appetite rises globally while the rupee weakens, domestic gold price moves can differ from international bullion trends.
That makes cross-market tracking important. Investors watching Bitcoin, XAUUSD, and the dollar together often get a clearer picture of how global sentiment may influence Indian asset allocation.
What Should Traders Watch Next in Bitcoin Price Action?
Traders should watch whether Bitcoin can extend the breakout after hitting the 2.5-month high on Friday, April 17. The next clue will come from how price behaves around chart support and resistance.
If the recent basing pattern turns into sustained upside follow-through, the bullish case will strengthen. If Bitcoin slips back into choppy lower trading, the market may need more time before any bigger uptrend becomes established.
For Indian investors, the key watchpoint is whether this improvement in crypto risk appetite begins to influence broader market sentiment, including positioning in gold, bullion, and other precious metals. A confirmed breakout in Bitcoin could support risk-on trading globally, while failure at resistance could revive safe-haven interest.


