
# Bitcoin Price Faces Stiff Resistance on April 28 Chart Alert
Bitcoin prices were softer in early U.S. trading on Tuesday, April 28, as bulls ran into strong technical resistance just above current levels. The daily chart still shows an uptrend, but that bullish structure now needs fresh momentum to remain intact.
For Indian investors tracking global risk assets alongside gold price moves, the setup matters because Bitcoin often competes with bullion for speculative and safe-haven flows. When Bitcoin stalls at resistance, some capital can rotate back toward gold, silver, and other precious metals, especially if volatility rises in the broader market.
What happened to Bitcoin prices on April 28?
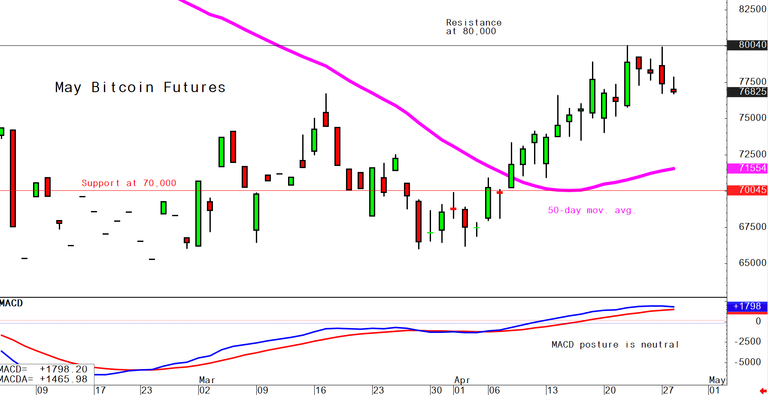
Bitcoin futures weakened in early U.S. trading on Tuesday, April 28. According to Kitco News, May bitcoin futures came under pressure after buyers failed to push through stiff overhead chart resistance.
That means the market met selling interest at higher levels. Traders often treat such resistance zones as a near-term barrier, especially when momentum slows after a prior rally.
Why is chart resistance important for Bitcoin traders?
Chart resistance matters because it can cap rallies and trigger profit-taking. In this case, bulls encountered technical resistance just overhead from present prices, which suggests the market needs stronger buying conviction to extend the advance.
If Bitcoin cannot break above resistance, the uptrend can lose momentum quickly. That can encourage short-term traders to reduce long positions and wait for a clearer breakout signal.
What does “stiff technical resistance overhead” mean?
Stiff technical resistance means a price zone above the current market where sellers have become active. When Bitcoin approaches that area, the market may struggle to move higher unless new demand enters decisively.
For chart-focused traders, such levels often shape intraday and swing-trading decisions. They can also influence sentiment across correlated risk assets.
Is the Bitcoin uptrend still intact?
Yes, the Bitcoin uptrend remained in place on the daily bar chart as of Tuesday, April 28. However, the bullish trend was showing signs of strain because buyers needed to show fresh power soon to keep that structure alive.
In practical terms, the trend had not yet broken down, but it was being tested. A trend can stay technically positive even while momentum fades near resistance.
What do bulls need to do next?
Bulls need to regain momentum and push prices through overhead resistance. A successful breakout would strengthen the existing uptrend and improve near-term technical sentiment.
If they fail, support levels become more important. Traders would then watch whether Bitcoin can hold key chart support and avoid a deeper pullback.
What is Wyckoff’s Market Rating for Bitcoin?
Wyckoff’s Market Rating for Bitcoin was 6.0 out of 10.0 on April 28. On that scale, 1.0 is the most bearish reading and 10.0 is the most bullish.

A 6.0 rating signals a modest bullish technical advantage, but not an overwhelmingly strong one. It suggests buyers still hold some control, though the market is not in a runaway bullish phase.
How should Indian investors read this Bitcoin chart signal?
Indian investors should read this as a near-term technical caution signal rather than a full trend reversal. Bitcoin remained in an uptrend on April 28, but the failure to clear resistance showed that upside momentum was not strong enough yet.
For investors in India, this matters because shifts in global appetite for Bitcoin can affect broader sentiment toward alternative assets, including gold and silver. If risk appetite weakens, demand for safe-haven assets such as bullion can improve, especially when rupee volatility and global macro uncertainty support domestic gold prices.
Does this affect gold investors in India?
Yes, indirectly. Bitcoin and gold do not move together consistently, but both attract investors looking for diversification outside traditional financial assets.
When Bitcoin meets resistance and speculative enthusiasm cools, some investors reassess exposure across risk assets and safe-haven assets. That can make gold price trends, XAUUSD movements, and INR-linked bullion premiums more relevant for Indian portfolios.
What should traders watch next after the April 28 Bitcoin alert?
Traders should watch the key technical support and resistance lines on the daily chart. According to Kitco News, those levels will decide whether the current uptrend resumes or starts to weaken further.
A breakout above resistance would give bulls the fresh power the chart now demands. A failure to break higher, followed by pressure on support, would raise the risk of a broader correction.
For Indian market participants, the next watchpoint is whether Bitcoin can convert its daily uptrend into a confirmed breakout while gold price and precious metals sentiment respond to any shift in global risk appetite.


