
# Bitcoin Price Basing Turns Bullish? Key April 9 Chart Levels
April bitcoin futures were nearly unchanged in early U.S. trading on Thursday, April 9, but the chart setup suggests a possible base is forming. That matters because sideways and choppy trade at lower levels can mark the early stage of a fresh uptrend, even though bears still hold the near-term technical edge.
For Indian investors tracking global risk sentiment alongside gold price moves, bitcoin’s technical structure is worth watching. Bitcoin often trades as a high-beta risk asset, while gold and bullion typically attract safe-haven demand when volatility rises.
What happened to bitcoin prices on April 9?
April bitcoin futures were near steady in early U.S. trading on Thursday, April 9. The market did not show a sharp breakout or breakdown at the start of the U.S. session.
That muted move followed a week in which bulls gained a bit of momentum. The improvement was modest, but it was enough to raise the possibility that bitcoin is trying to stabilize after earlier weakness.
Why are analysts calling the current bitcoin pattern a base?
The answer is that sideways and choppy trading at lower price levels can be basing action. In technical analysis, a base often forms when selling pressure starts to fade and buyers gradually absorb supply.
The current bitcoin pattern fits that description. Prices have been moving sideways at depressed levels rather than extending sharply lower, which could set the stage for a price uptrend in the near term if buyers follow through.
What does basing mean for trend direction?
Basing does not confirm a rally on its own. It signals that the market may be preparing for a directional move higher if resistance levels break.
For traders in crypto, bullion, and broader precious metals markets, this kind of setup often marks an inflection point. A confirmed base can shift sentiment quickly, especially when broader macro risk appetite improves.
Do bears still control the near-term bitcoin trend?
Yes, bears still have the overall near-term technical advantage. Even with this week’s modest improvement, the chart has not yet turned decisively bullish.
That means traders should treat the current setup as a developing pattern, not a completed reversal. Until bitcoin futures break key resistance levels, sellers retain the stronger short-term position.
What does Wyckoff’s Market Rating of 4.0 mean?
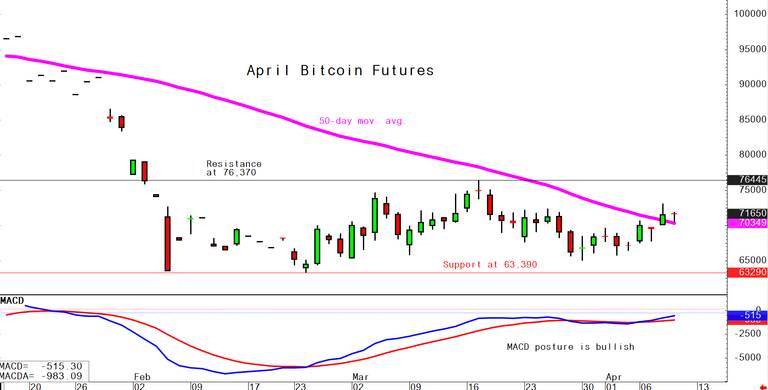
Wyckoff’s Market Rating came in at 4.0 out of 10.0 on April 9. On that scale, 1.0 is the most bearish and 10.0 is the most bullish.
A 4.0 reading indicates a market that remains technically weak, though not in extreme breakdown mode. It supports the view that bears still lead for now, while bulls are trying to build momentum from a low base.

Which bitcoin chart levels should traders watch now?
The key focus is on support and resistance lines on the daily chart. These technical markers will help determine whether the current basing action turns into a sustained uptrend or fails.
Resistance levels matter because a breakout above them would strengthen the bullish basing argument. Support levels matter because a break below them would show that bears still dominate and that the recent stabilization was temporary.
Why do these levels matter for Indian investors?
Indian investors increasingly track bitcoin, gold price, and XAUUSD together as part of a broader view on global capital flows. When risk appetite improves, bitcoin can attract speculative demand, while gold and other precious metals may respond differently depending on the U.S. dollar, Treasury yields, and safe-haven flows.
If bitcoin confirms a base and rallies, it could reflect a stronger appetite for risk assets globally. If the pattern fails, investors in India may see renewed preference for defensive allocation, including bullion and other precious metals, particularly if INR volatility or global macro uncertainty rises.
How does bitcoin’s chart matter for gold market watchers in India?
Bitcoin’s chart matters because it offers a read on investor risk appetite, while gold serves a different role as a safe-haven asset. The two do not always move in opposite directions, but shifts in speculative sentiment can influence portfolio flows.
For Indian market participants, that makes cross-asset tracking important. A stabilizing bitcoin market can signal improving confidence in risk assets, while persistent technical weakness can push attention back toward gold price trends, physical bullion demand, and hedging against volatility.
Indian investors should also remember that global asset moves can have different local effects once converted into rupees. Even when international prices are steady, INR fluctuations can change domestic pricing for both gold and crypto-linked exposures.
The next watchpoint is simple: traders need to see whether April bitcoin futures can hold their base and push through resistance, or whether bears use the current pause to reassert control. That decision on the chart could shape near-term sentiment across risk assets, including how Indian investors compare bitcoin with gold and other precious metals.


