
# Bitcoin Price Alert: Bears Keep Technical Edge on April 1
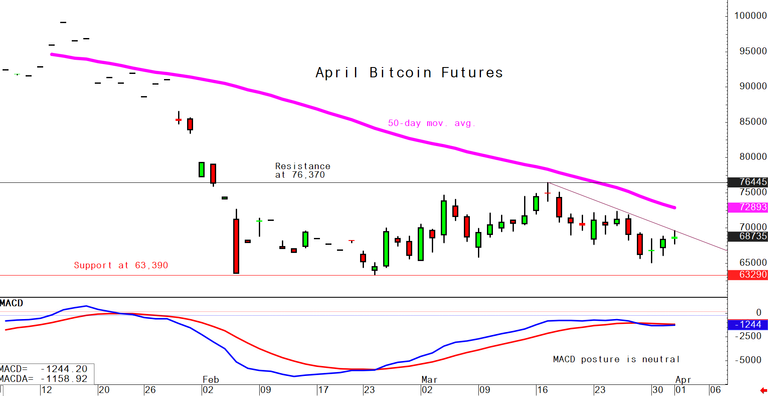
April bitcoin futures traded firmer in early U.S. trading on Wednesday, April 1, but the broader technical picture still favored sellers. Bulls managed to stabilize bitcoin this week, yet a price downtrend line remained intact on the daily chart, leaving bears with the near-term advantage.
For Indian investors, this setup matters beyond crypto alone. Bitcoin weakness can influence broader risk appetite across global markets, including gold, silver, bullion-linked exchange products, and other safe-haven trades that many Indian investors track alongside XAUUSD and precious metals.
What is happening to bitcoin price on April 1?
Bitcoin price was slightly stronger in early U.S. trading on Wednesday, April 1, but it had not reversed its bearish chart structure. The session showed that buyers were active enough to steady the market, yet not strong enough to break the prevailing downtrend.
The key point from the daily chart alert is that April bitcoin futures were firmer, not decisively bullish. In technical terms, a market can rise modestly during a session and still remain under bearish control if the broader pattern of lower highs or a downtrend line stays in place.
That is the case here. Bulls stabilized the market this week, which is constructive in the short term, but bears still held the overall near-term technical advantage.
Why do bears still control the bitcoin chart?
Bears still control the bitcoin chart because the price downtrend line remained in place on the daily chart. As long as that line is not broken convincingly, technicians generally view rallies as limited recoveries rather than a full trend reversal.
The source article makes that technical reading explicit. It says bears retain the overall near-term technical advantage even after this week's stabilization.
For traders, that means resistance levels remain important. Until bitcoin futures clear those chart barriers, bearish momentum can continue to shape price action.
What does the Wyckoff Market Rating of 3.5 mean?
The Wyckoff Market Rating of 3.5 out of 10.0 signals a bearish technical bias. On this scale, 1.0 is the most bearish reading and 10.0 is the most bullish.
A 3.5 rating does not mean a collapse is guaranteed. It means market structure still favors the downside unless buyers can improve the chart picture by breaking resistance and ending the downtrend.
That low reading supports the article's main message: bitcoin bulls have shown some stabilizing power, but they have not yet regained technical control.
What support and resistance levels should traders watch?
Traders should watch the chart's key support and resistance lines because those levels will determine whether stabilization turns into recovery or fades into another leg lower. The original alert specifically points readers to the important technical support and resistance lines on the daily chart.
Although the source article does not publish exact price levels in the text, its technical framework is clear. Support marks the zone where buyers may try to defend bitcoin futures, while resistance marks the area where sellers may reassert control.
A break below support would strengthen the bearish case. A push above resistance, especially if it breaks the downtrend line, would be an early sign that bulls are improving the near-term outlook.
Why does the downtrend line matter so much?
The downtrend line matters because it visually defines the current bearish structure. When price remains below that line, chart analysts usually assume sellers still control the trend.
If bitcoin breaks above that line and holds the move, sentiment can shift quickly. Until then, the market remains vulnerable to renewed selling pressure.

How does this bitcoin setup matter for Indian investors?
This bitcoin setup matters for Indian investors because it reflects global risk sentiment, which can spill over into gold price trends, safe-haven demand, and rupee-based investment decisions. Indian investors often compare high-volatility assets like bitcoin with gold, bullion, and other precious metals when managing portfolios.
When bitcoin remains under technical pressure, some investors rotate toward defensive assets. That can support interest in gold as a safe-haven, especially if uncertainty rises in global markets.
The India angle is also important because domestic pricing depends on both the international asset move and the rupee. If global risk aversion lifts gold while the Indian rupee weakens against the U.S. dollar, local gold prices in INR can strengthen further.
Should Indian investors compare bitcoin and gold directly?
Indian investors can compare bitcoin and gold, but they should not treat them as interchangeable assets. Bitcoin trades as a high-volatility risk asset, while gold has a longer history as a store of value, reserve asset, and portfolio hedge.
That distinction matters when technical weakness appears in bitcoin. A bearish bitcoin chart does not automatically mean gold price will rise, but it can shift investor attention toward safer assets such as physical gold, digital gold, sovereign gold bonds in applicable windows, gold ETFs, and bullion.
What should investors watch next after the April 1 bitcoin chart alert?
Investors should watch whether bitcoin bulls can break the daily downtrend line and improve the weak 3.5 Wyckoff Market Rating. Those two signals will say more about the next move than a single firmer trading session.
The immediate takeaway is straightforward: Wednesday, April 1 brought firmer early U.S. trading in April bitcoin futures, but not a confirmed bullish reversal. Bears still held the near-term technical edge.
For Indian market participants, the next watchpoint is whether crypto weakness starts affecting broader cross-asset sentiment, including safe-haven flows into gold, silver, and other precious metals. If bitcoin cannot clear resistance, defensive positioning may stay relevant across global and Indian portfolios.


