# Gold Price Steadies as Soft US Factory Data Lifts Bullion
Spot gold and silver ended the North American session on a firmer note on Friday as weaker-than-expected U.S. manufacturing data and easing Treasury yields improved support for precious metals. For Indian investors, softer U.S. yields and a weaker U.S. dollar can help global bullion prices, although rupee moves will also shape domestic gold rates.
Why did gold price and silver rise after the U.S. data?
Gold and silver gained support because softer U.S. manufacturing data pushed Treasury yields lower and improved demand for safe-haven assets. That combination helped bullion recover after a choppy start to the session.
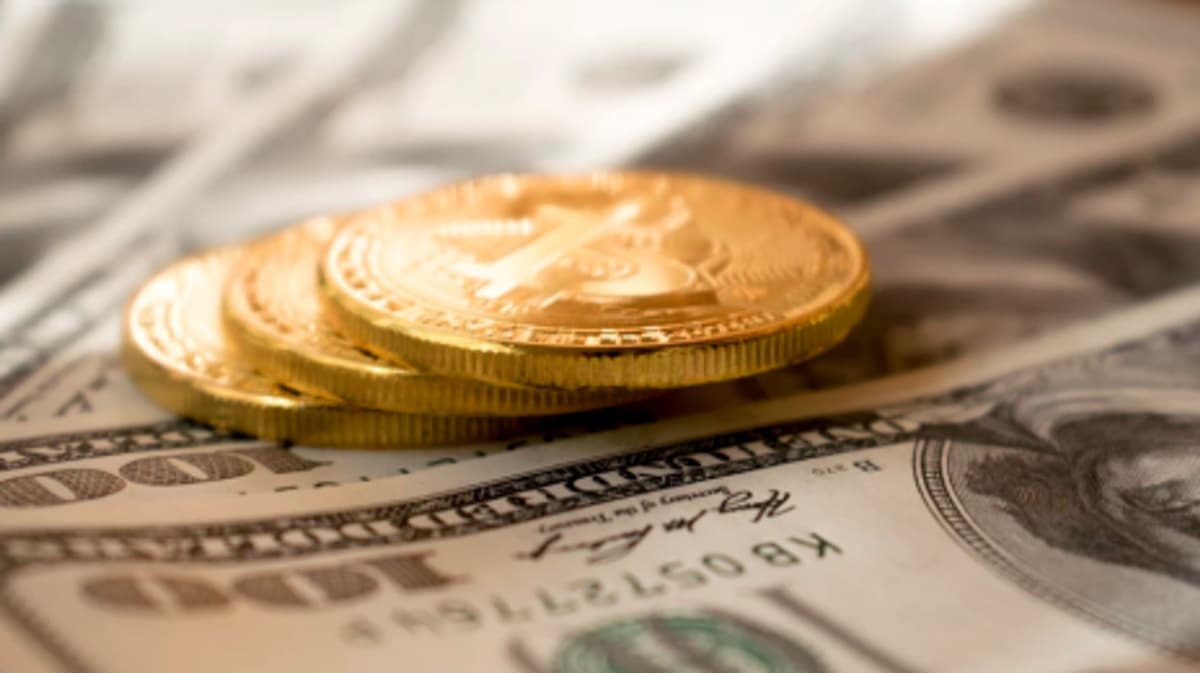
Spot gold strengthened through the late morning and afternoon following early volatility. By the close, spot gold traded at $4,613.83 per troy ounce, effectively flat on the day, while spot silver closed at $75.357 per troy ounce, up 2.18%.
The main U.S. release during the North American session was the ISM manufacturing report for April. The report came in weaker than expected but stayed in expansion territory, reinforcing concerns that U.S. industrial activity is slowing rather than contracting outright.
An earlier S&P Global manufacturing PMI reading also pointed to only modest expansion. Taken together, the two reports signaled softer momentum in the U.S. manufacturing sector, which capped Treasury yields and supported XAUUSD and silver prices.
How did Treasury yields and the U.S. dollar affect bullion?
Lower Treasury yields and a weaker U.S. dollar supported gold price and silver by reducing the opportunity cost of holding non-yielding assets. That macro backdrop helped precious metals finish the session on a positive footing.
The yield on the benchmark 10-year U.S. Treasury note fell to around 4.372% after the softer tone in U.S. economic data. When yields ease, gold often becomes more attractive because bullion does not pay interest.
The U.S. dollar index was also modestly weaker on the day. A softer dollar can make gold and silver cheaper for buyers using other currencies, which can support international demand.
For Indian investors, this matters because global gold price moves often flow into domestic bullion rates. If the Indian rupee weakens against the U.S. dollar, local prices can remain elevated even when international gold moves only modestly.
What did the Federal Reserve, ECB and Bank of England signal for gold?
The policy message from major central banks remained cautious, with no rush to cut rates, but softer U.S. data raised expectations that cooling growth could eventually change that outlook. That shift is supportive for gold if investors start pricing in a less restrictive path for interest rates.
Markets continued to assess this week’s meetings from the Federal Reserve, European Central Bank and Bank of England. The broad takeaway was that policymakers still do not want to ease monetary policy quickly.
However, Friday’s weaker U.S. manufacturing data added to the view that economic growth may be cooling. If that trend deepens, markets may begin to expect a more dovish policy path later, which could support gold price, silver, and wider precious metals demand.
How did oil prices and geopolitics influence precious metals?
Geopolitical tensions involving the U.S.-Iran conflict continued to support energy markets, but a modest pullback in crude oil reduced inflation worries and helped bond yields fall. That easing in yields added another supportive layer for bullion.
Crude oil had recently pushed higher on geopolitical concerns, but during Friday’s session the move cooled. The key outside markets showed Nymex WTI crude oil slightly lower and trading near $102.00 a barrel by late afternoon.
Because lower oil prices can ease inflation pressure expectations, they can also reduce upward pressure on bond yields. That mechanism helped gold and silver hold gains through the North American session.
For Indian buyers, oil trends matter beyond global inflation. Higher crude prices can pressure India’s import bill, influence the rupee, and indirectly affect domestic gold prices.
How did stock markets perform alongside gold and silver?
North American equity markets finished mixed, showing that investors did not move decisively into or out of risk assets. That mixed tone allowed gold and silver to gain support mainly from macro data and yields rather than from a broad risk-off panic.
The S&P 500 ended little changed after fluctuating through the session. The Dow Jones Industrial Average posted a modest decline, while the Nasdaq Composite finished slightly higher, supported by ongoing strength in large-cap technology shares.
Canadian equities were also mixed, with the TSX posting a marginal decline. This cross-asset backdrop suggested caution rather than aggressive repositioning.
What are the key gold price levels traders should watch now?
Spot gold bulls regained near-term momentum, but they still need a clear break above nearby resistance to confirm stronger upside. Traders are now focused on whether gold can push through the $4,615 to $4,642 resistance zone.
If spot gold breaks above $4,615 to $4,642, the next upside targets come in at $4,685 to $4,720. That zone is now the key technical hurdle for XAUUSD bulls.
On the downside, bears need to force a break below $4,568 to regain control. If that happens, deeper downside targets stand at $4,532 and then $4,485.
The immediate technical map for spot gold is clear:
Gold resistance levels
- First resistance: $4,615
- Next resistance: $4,642
Gold support levels
- First support: $4,568
- Next support: $4,532
What are the key silver price levels traders should watch now?
Spot silver showed stronger momentum than gold, and bulls now need to clear nearby resistance to extend the rally. The first zone to watch is $74.10 to $74.45.
If silver rises above $74.10 to $74.45, the next upside target is $75.20. That would strengthen the bullish short-term technical picture.
On the downside, bears need a break below $73.05. If silver falls through that level, the next downside targets are $72.30 and then $71.40.
The immediate technical map for spot silver is as follows:
Silver resistance levels
- First resistance: $74.10
- Next resistance: $74.45
Silver support levels
- First support: $73.05
- Next support: $72.30