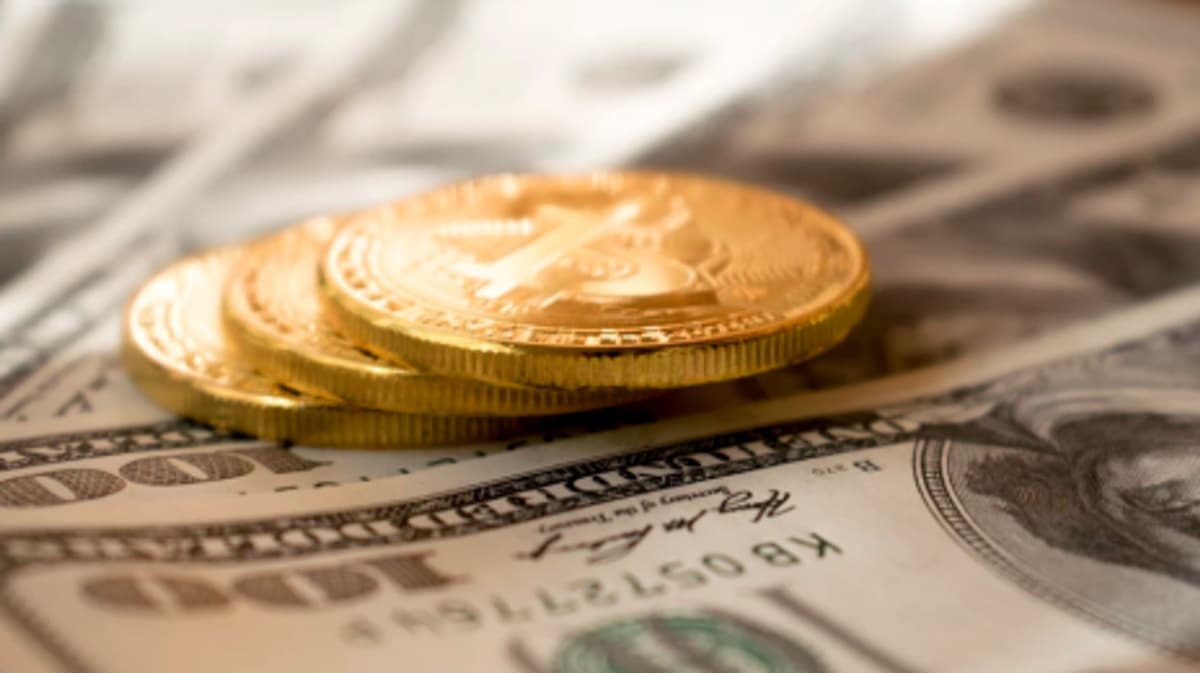
Spot gold fell after a hotter-than-expected US producer inflation reading pushed Treasury yields and the US dollar higher, adding fresh pressure to bullion just a day after an upside CPI surprise. For Indian investors, the move matters because global gold price weakness can be partly offset if the rupee weakens against the dollar, while elevated crude oil prices can worsen imported inflation and keep precious metals volatility high.
Why did gold prices fall after the US PPI data?
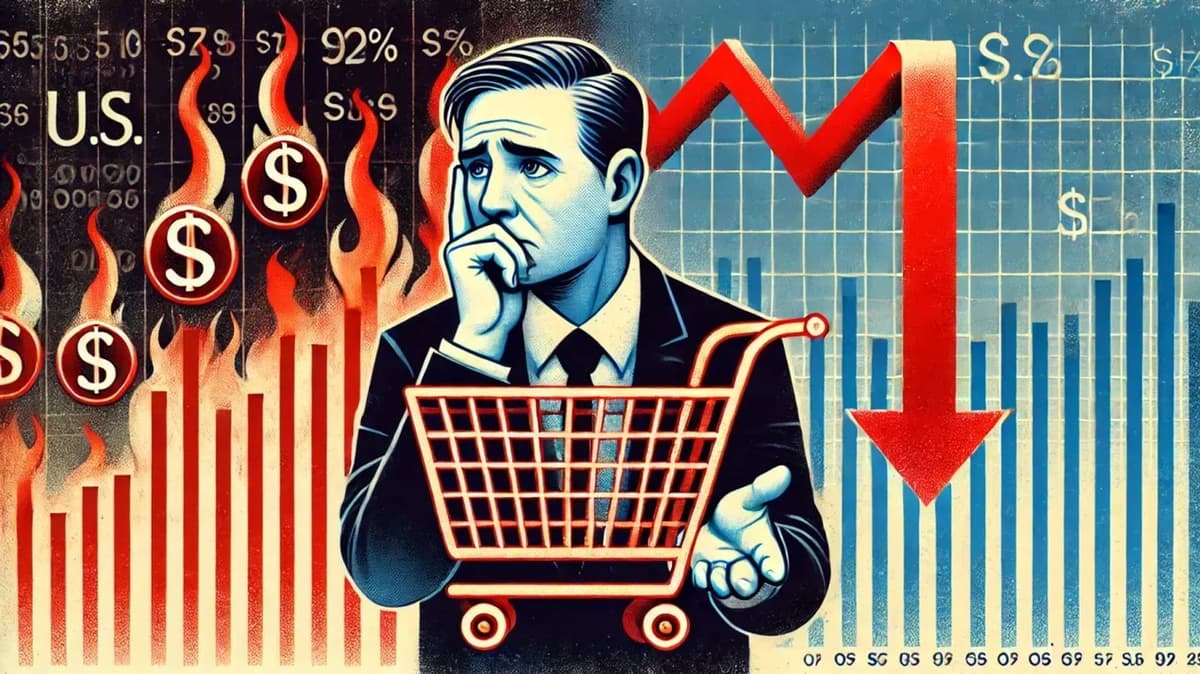
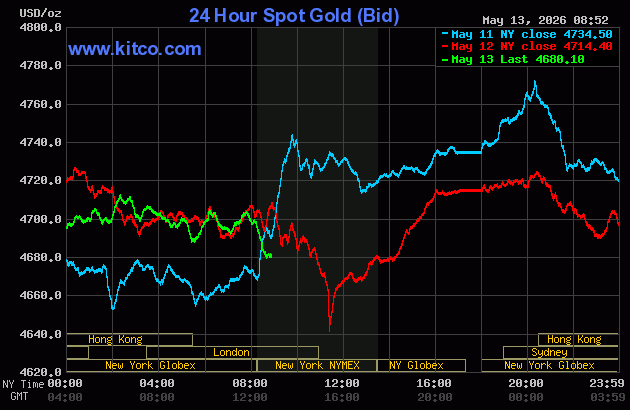
Gold prices fell because the April US Producer Price Index reinforced inflation concerns and raised the market’s expectations that the Federal Reserve may need to keep interest rates higher for longer. Higher yields and a firmer US dollar typically reduce the appeal of non-yielding assets such as gold.At the time of writing on Wednesday morning in early US trading, spot gold traded near $4,682.53 per ounce, down 0.70% on the session. Spot silver traded at $86.167 per ounce, down 0.44%.
Gold traded in a session range of $4,678.40 to $4,727.60, leaving XAUUSD below Tuesday’s $4,700 technical battleground but above the overnight low. Silver traded between $82.710 and $87.920, staying above Monday’s breakout levels but retreating from the intraday high.
What did the April US PPI report show?
The April US PPI report showed a sharp acceleration in producer inflation, keeping inflation risk at the center of the gold and silver outlook. That matters for bullion because sticky inflation can support the hard-asset case, but it can also lift bond yields and raise the policy hurdle for rate cuts.Final demand prices rose 1.4% in April, following gains of 0.7% in March and 0.6% in February. That was the largest monthly increase since March 2022.
On an annual basis, the index rose 6.0% year over year, the largest 12-month increase since December 2022. Within the report, final demand goods rose 2.0% and final demand services rose 1.2%.
How did energy prices drive inflation higher?
Energy was the biggest pressure point in the inflation data. Rising energy costs feed directly into inflation expectations, bond yields and the US dollar, all of which can influence gold price action.Final demand energy prices rose 7.8% in April. Gasoline jumped 15.6%, while crude petroleum prices rose 11.3% at the intermediate-demand stage.
For gold, this mix created a two-way push. Higher inflation supports the case for holding hard assets such as bullion, but the same data also increased the implied Federal Reserve rate hurdle. For silver, the industrial-demand theme and supply-deficit narrative continued to offset the drag from a stronger dollar and still-elevated yields.
How are the Iran conflict and oil prices affecting gold and silver?
The Iran conflict is still shaping the macro backdrop for precious metals, mainly through oil and inflation rather than through a direct safe-haven surge in gold. That shift is important because geopolitical stress is no longer giving gold the same clean upside impulse it delivered earlier in the conflict.A fragile US-Iran cease-fire was still holding on Wednesday morning. Even so, oil markets remained volatile above $100 as traders tracked supply disruptions, risk around the Strait of Hormuz, and planned US-China talks.
The market’s risk premium is now feeding more into energy-led inflation than into immediate haven demand for bullion. For Indian investors, that is especially relevant because higher crude prices can pressure India’s import bill, lift domestic inflation risks and influence the rupee, which in turn affects local gold rates.
Why does Kevin Warsh’s Fed Board confirmation matter for bullion?
Kevin Warsh’s Senate confirmation matters because it adds another layer of uncertainty around Federal Reserve leadership, policy credibility and future interest-rate expectations. Gold is highly sensitive to changes in real yields, Fed independence concerns and US dollar direction.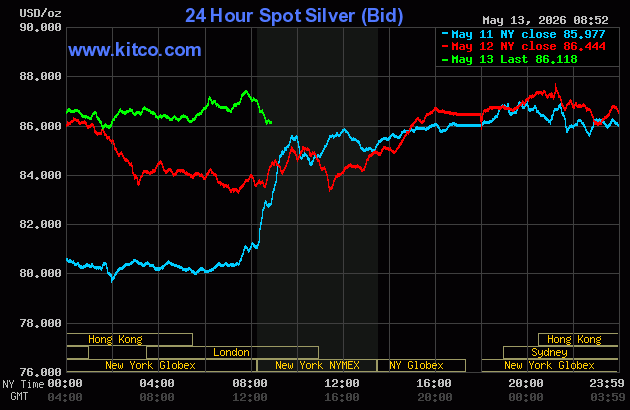
Warsh secured a 51-45 Senate confirmation to the Federal Reserve Board. The vote cleared one hurdle toward a possible Fed chair transition later this week.
That development keeps Fed independence, real rates and the US dollar in focus for gold traders after the inflation data. If markets begin to price a more hawkish policy path or political pressure on monetary policy, XAUUSD could remain volatile even if inflation continues to support long-term bullion demand.
What are the key outside markets signaling for gold today?
The broader market backdrop remains mixed for bullion, with weaker crude on the day but still-elevated oil prices, a firmer dollar and high Treasury yields. Those signals usually create short-term headwinds for gold and silver.Nymex WTI crude oil traded around $97.37 a barrel, while Brent crude was near $106.67 a barrel. The US dollar index was firmer.
The yield on the benchmark 10-year US Treasury note traded near 4.485%. For Indian investors, a sustained rise in US yields and the dollar can pressure global bullion prices, though rupee weakness can cushion domestic gold price declines.
What are the key technical levels for gold price now?
Gold remains at an important technical inflection point, with traders watching whether XAUUSD can reclaim resistance above $4,711 or break support below $4,680. These levels are likely to shape near-term momentum.Spot gold bulls’ next upside objective is to push prices back above the $4,711 to $4,723 resistance zone. A sustained move above that area could target the 50-day moving average near $4,749 and then the 100-day moving average near $4,789.

On the downside, bears’ next near-term objective is a break below the $4,680 to $4,702 support area. If that zone fails, deeper downside targets come in at $4,648 and then the 200-day moving average near $4,329.
Gold technical levels to watch
- First resistance: $4,711 to $4,723
- Second resistance: $4,749
- First support: $4,680 to $4,702
- Second support: $4,648
- Major deeper support: 200-day moving average near $4,329
What are the key technical levels for silver price now?
Silver is holding above earlier breakout territory, but it needs to reclaim the upper resistance zone to restore stronger bullish momentum. Its structure remains more resilient than gold’s, although near-term volatility is still high.Spot silver bulls’ next upside objective is to drive prices back above the $87.26 to $89.73 area. A move above that zone would target $90.02 and then the $91.34 to $98.49 retracement zone.
For the bears, the next downside objective is a break below $84.90. If silver loses that level, deeper downside targets sit at $84.00 and then $82.12.
Silver technical levels to watch
- First resistance: $87.26 to $89.73
- Second resistance: $90.02
- Higher target: $91.34 to $98.49
- First support: $84.90
- Second support: $84.00
- Deeper support: $82.12