Spot gold fell because hotter-than-expected U.S. inflation data, a firmer U.S. dollar, and Treasury yields near 4.5% outweighed safe-haven demand from the U.S.-Iran conflict. For Indian investors, that mix matters because global bullion prices, USD/INR moves, and crude oil shocks can quickly feed into domestic gold rates.
Why did gold prices fall after the April PPI report?
Gold prices fell because the April U.S. producer-price report sharply raised inflation concerns and weakened hopes for near-term Federal Reserve rate cuts. That pushed the dollar higher and kept U.S. bond yields elevated, both of which pressured XAUUSD.In late U.S. trading on Wednesday, spot gold traded near $4,687.20 per ounce, down 0.58% on the session. Gold could not hold above the $4,700 area even though geopolitical risk in the Middle East continued to support safe-haven positioning.
What did the April PPI data show?
The April producer-price report showed a broad inflation surprise. Final-demand PPI rose 1.4% in April, following a 0.7% gain in March and a 0.6% increase in February.That was the largest monthly advance since March 2022. On a 12-month basis, final-demand PPI rose 6.0%.
The details also pointed to broad price pressure:
- Final-demand goods rose 2.0%
- Services increased 1.2%
- Energy jumped 7.8%
- Gasoline surged 15.6%
How did CPI add to the pressure on bullion?
The PPI shock came right after a strong April CPI report, which reinforced the inflation narrative. Together, the two reports kept the rate-cut trade under pressure and reduced support for non-yielding assets like gold.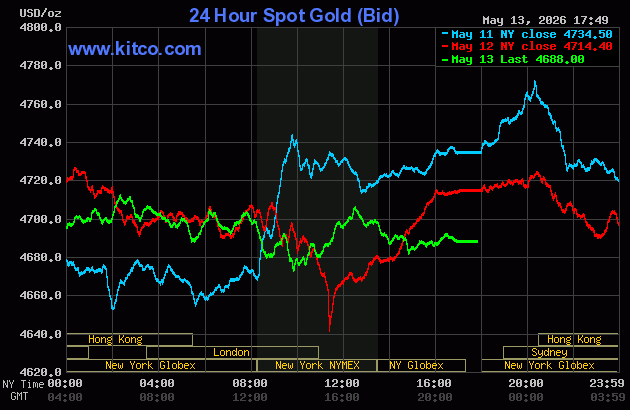
Tuesday’s CPI release showed consumer prices up 0.6% month-on-month and 3.8% year-on-year. Core CPI rose 0.4% on the month and 2.8% over 12 months.
For bullion traders, the two-day inflation sequence mattered because sticky inflation tends to keep Federal Reserve policy tighter for longer. That usually lifts real and nominal yields, supports the dollar, and makes gold less attractive in the short term.
How is the U.S.-Iran conflict influencing gold prices?
The U.S.-Iran conflict is still supporting safe-haven demand for gold, but it is also driving oil-linked inflation fears that limit upside in bullion. In other words, the same geopolitical shock is helping and hurting gold at the same time.Ceasefire diplomacy has stalled, and the Strait of Hormuz remains impaired. Oil flows through the waterway are still far below normal.
Why does the Strait of Hormuz matter for precious metals?
The Strait of Hormuz matters because it is a critical artery for global energy markets, and disruptions there can lift oil prices, inflation expectations, and market volatility. Those shifts often spill directly into gold, silver, currencies, and bond yields.Roughly 20 million barrels a day of crude oil and oil products moved through the strait in 2025, equal to about one-quarter of global seaborne oil trade. That makes any sustained disruption highly relevant for precious metals investors.
For gold, the conflict creates a two-sided trade:
- It boosts safe-haven and geopolitical hedging demand.
- It also lifts oil-driven inflation expectations.
- Higher inflation expectations can push nominal Treasury yields higher.
- A stronger yield backdrop can support the U.S. dollar.
- Higher yields and a firmer dollar capped gold on Wednesday.
Why is silver outperforming gold and testing $90?
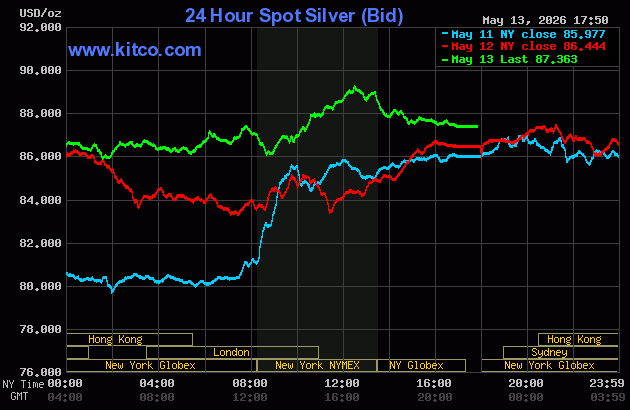
Silver outperformed gold because industrial-demand interest and relative-value buying offset the same yield and dollar pressures that weighed on bullion. That kept the market focused on the psychologically important $90 level.In late U.S. trading, spot silver stood at $87.660 per ounce, up 1.09% on the session. Silver’s intraday range stretched from $82.710 to $89.470, keeping the rally intact and extending its outperformance versus gold.
What is driving the gold-silver ratio compression trade?
The gold-silver ratio compression trade remains active because traders are favoring silver’s catch-up potential against gold. Relative-value buying and industrial-demand expectations have helped silver absorb macro headwinds better than gold.Even with Treasury yields near 4.5% and the U.S. dollar index firmer after the PPI release, silver held up better. That divergence suggests traders still see stronger upside momentum in the white metal, especially if it can reclaim the $90.00 area.
For Indian precious metals buyers, stronger silver can also influence retail interest in coins, bars, and tactical allocations, particularly when gold looks range-bound at elevated price levels.
What are crude oil, the dollar, and Treasury yields signaling now?
The broader macro backdrop still looks restrictive for gold because crude remains elevated, the U.S. dollar is firmer, and 10-year Treasury yields are holding near 4.5%. Those three markets are central to near-term price direction in XAUUSD and silver.The key outside markets showed:
- Nymex WTI crude oil around $101.02 a barrel
- Brent crude near $105.63 a barrel
- The U.S. dollar index firmer after the PPI release
- The 10-year U.S. Treasury yield near the 4.5% area

What are the key technical levels for gold price now?
Gold remains under pressure below the $4,700 area, and traders are watching whether bulls can retake the next resistance zone. The chart setup now centers on a battle between resistance at the upper end of the recent range and support around the mid-$4,600s.What upside levels should gold bulls watch?
Spot gold bulls’ next upside objective is a move back above the $4,774 to $4,792 resistance zone. If gold sustains a breakout above that band, the next upside targets are $4,891 and then $5,024.First resistance is seen at $4,774 and then at $4,792.
What downside levels should gold bears watch?
Gold bears’ next near-term downside objective is a break below $4,638. If that level gives way, deeper downside targets are $4,550 and then $4,530.First support is seen in the $4,660 to $4,680 zone, followed by $4,638. For Indian market participants, these global support and resistance levels can shape MCX gold sentiment, especially when USD/INR volatility rises alongside crude.
What are the next technical levels for silver price?
Silver bulls remain focused on a clean break above $90, which would strengthen the case for another leg higher. The metal has already stretched close to that level, so the next move could be technically important.What happens if silver breaks above $90?
If spot silver pushes back above the $90.00 area, the next upside targets are $95.00 to $96.00 and then $100.00. First resistance is seen at $90.00, followed by $95.00 to $96.00.What support levels matter if silver pulls back?
The next downside objective for silver bears is a break below $85.00 to $86.00. If that support zone fails, deeper downside targets are $80.00 and then $78.00 to $79.00.Next support is seen at $85.00 to $86.00 and then at $80.00. Indian investors tracking silver should now watch whether momentum above $90 survives another round of inflation data, dollar strength, and Middle East developments.
The immediate watchpoint is clear: if inflation stays hot and the Federal Reserve rate-cut trade keeps fading, gold may remain capped unless geopolitical risk intensifies further. But if silver clears $90 decisively while oil, yields, and the dollar stay elevated, the precious-metals complex could split further, with silver leading and gold lagging in the short term.