# Gold Price Rebounds Above $4,500 as Yields Ease, Silver Jumps
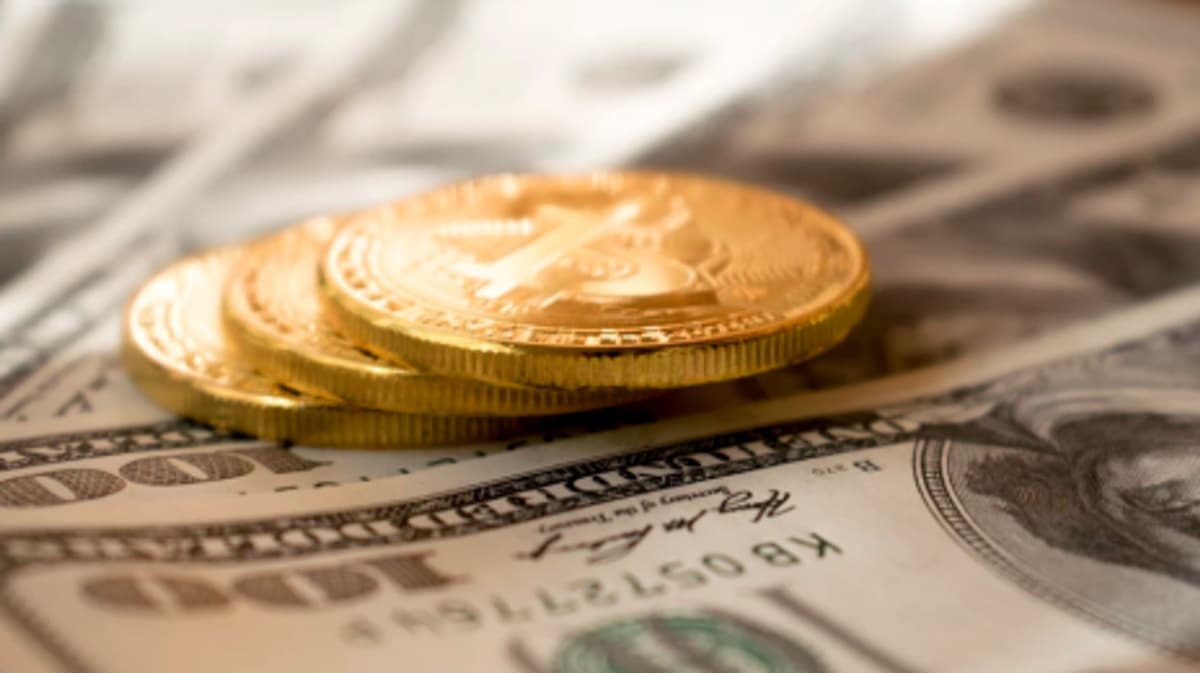
Gold prices steadied above the key $4,500 level in early U.S. trading on Wednesday, while silver surged as Treasury yields eased and oil prices retreated from recent highs. For Indian investors, the move matters because global bullion prices, U.S. yields, crude oil and the dollar directly influence domestic gold rates in rupee terms.
Spot gold was trading near $4,503.70 per troy ounce, up 0.48% at the time of writing. Spot silver traded near $75.675, up 2.71% on the session.
Why did gold price rebound above $4,500 today?
Gold rebounded because U.S. Treasury yields pulled back from recent peaks, easing pressure on non-yielding assets like bullion. The softer yield tone helped XAUUSD defend the $4,500 zone after Tuesday’s selloff.
Gold and silver remain inside what the market is treating as a rate-shock zone created by last week’s inflation sequence. Still, Wednesday’s early trade looked less disorderly than Tuesday’s decline.
The benchmark 10-year U.S. Treasury yield slipped to around 4.64%, down 2.7 basis points, after testing its highest level since January 2025. The 30-year U.S. Treasury yield also eased after touching its highest level since 2007.
The U.S. dollar index remained firm, which limited upside in precious metals. Even so, the pause in yields gave gold enough room to hold above $4,500 and allowed silver to recover after Tuesday’s break below $74.
How is the Strait of Hormuz risk affecting gold and silver?
The Strait of Hormuz remains the main geopolitical channel linking oil, inflation expectations, bond yields and precious metals. However, the immediate market risk premium narrowed as shipping flows improved and diplomatic headlines turned less aggressive.

Three supertankers carrying 6 million barrels of crude attempted to transit the strait. That may mark the largest daily Gulf departure since the U.S.-Israel conflict with Iran began in February.
At the same time, the United States said the conflict with Iran could end “very quickly.” That combination reduced some immediate safe-haven urgency, even though the geopolitical threat has not disappeared.
For gold, the Hormuz story cuts both ways.
Why does unresolved Hormuz tension still support bullion?
Unresolved Hormuz risk supports defensive allocation into safe-haven assets such as gold. If the conflict escalates again, investors could quickly return to bullion as protection against geopolitical and market volatility.
Why can oil-driven inflation still limit gold upside?
Oil-driven inflation can cap gold’s gains if it pushes bond yields and the U.S. dollar higher. Gold does not pay interest, so rising real and nominal yields can make bullion less attractive in the short term.
Oil prices still traded above $100 a barrel, keeping inflation risk alive. But WTI crude fell toward $102, and Brent crude pulled back toward $109, which reduced some pressure on Treasury yields.
What are other markets signaling about gold, silver and risk appetite?
Other markets point to a modest improvement in risk sentiment, though traders remain cautious. U.S. equity futures strengthened before the open as yields dipped and oil pulled back.

The S&P 500 and Nasdaq were positioned to snap a three-day losing streak. Energy remained the equity sector most directly exposed to any renewed escalation around the Strait of Hormuz.
In commodities, crude stayed volatile but moved off this week’s highs. Copper was firmer, while Bitcoin held a bid as the rate move paused.
The clearest cross-market effects still sit in crude oil, shipping risk, Treasury duration, the U.S. dollar and energy-sensitive equities. These markets will continue to shape near-term direction for gold price and silver price.
Which data and Federal Reserve events are traders watching next?
Traders are focused on incoming U.S. housing, energy and Federal Reserve signals for fresh direction. The next catalysts on Wednesday were existing home sales and the EIA weekly petroleum status report at 10:30 a.m. ET, followed by Federal Reserve meeting minutes at 2 p.m. ET.
These releases matter because they can shift expectations for inflation, growth and interest rates. Any move in rate expectations can quickly feed into XAUUSD, silver, the dollar and Treasury yields.
At the time of writing, key outside markets showed:
- Nymex WTI crude oil around $102.05 a barrel
- Brent crude near $108.93
- U.S. dollar index firmer
- 10-year U.S. Treasury yield near the 4.6% area
What are the key technical levels for gold price now?
Gold bulls need a move back above the $4,537 to $4,572 resistance zone to regain stronger momentum. A sustained breakout could open the way to $4,600 and then $4,629.

On the downside, bears need to break gold below $4,500 to regain near-term control. If that happens, the next downside targets are $4,481 and then $4,400.
Gold price resistance levels
- First resistance: $4,537
- Next resistance: $4,572
- Bullish breakout target: $4,600
- Extended upside target: $4,629
Gold price support levels
- First support: $4,500
- Next support: $4,481
- Deeper downside target: $4,400
What are the key technical levels for silver price now?
Silver bulls need to reclaim the $77.00 to $78.00 zone to restore stronger upside momentum. A breakout above that area would target $78.92 and then $80.00.
On the downside, silver bears need a break below $73.90. If silver loses that support, the next downside levels come in at $72.58 and then $70.85.
Silver price resistance levels
- First resistance: $77.00
- Next resistance: $78.00
- Bullish breakout target: $78.92
- Extended upside target: $80.00
Silver price support levels
- First support: $73.90
- Next support: $72.58
- Deeper downside target: $70.85