# Gold Price Falls Below $4,540 as Yields Rise, Silver Slides
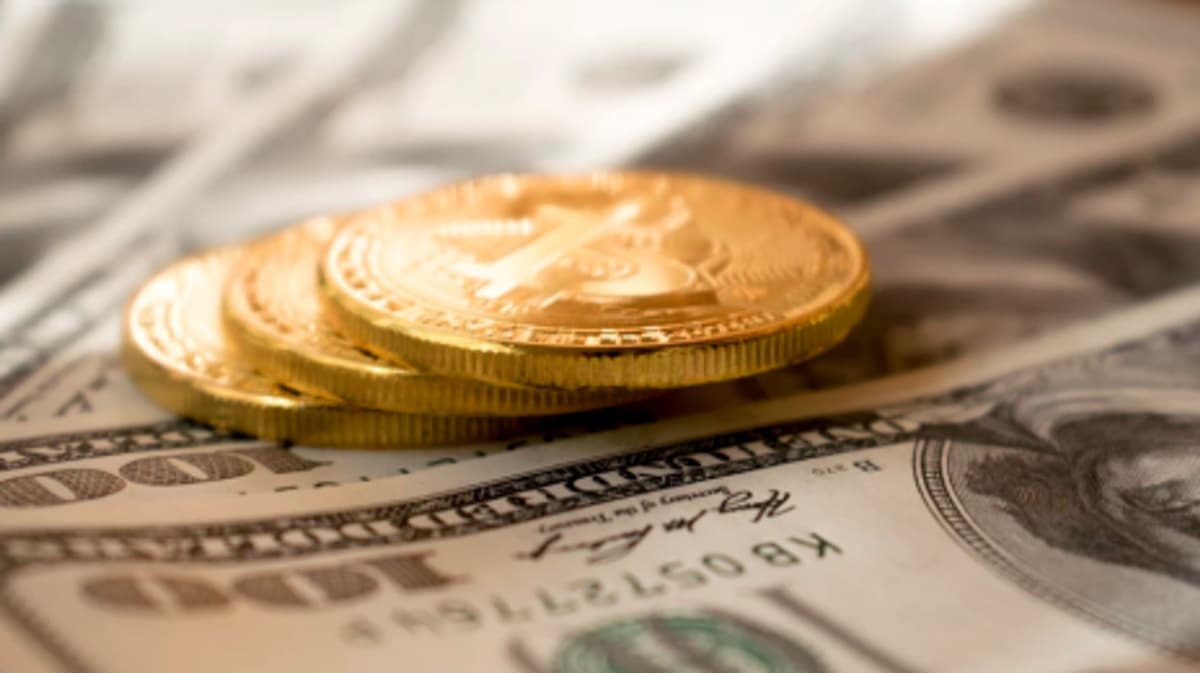
Spot gold fell below the $4,540 level in early U.S. trading on Tuesday as rising U.S. Treasury yields and a firmer U.S. dollar pressured bullion. Spot gold traded near $4,524.10 per troy ounce, down 0.90%, while spot silver dropped to $75.500, down 2.65% on the session.
For Indian investors, the latest move in XAUUSD matters because higher global yields and a stronger dollar can limit upside in international bullion prices, even when geopolitical risk remains elevated. Any parallel weakness or strength in the Indian rupee can further shape domestic gold rates.
Why did gold prices fall below $4,540 today?
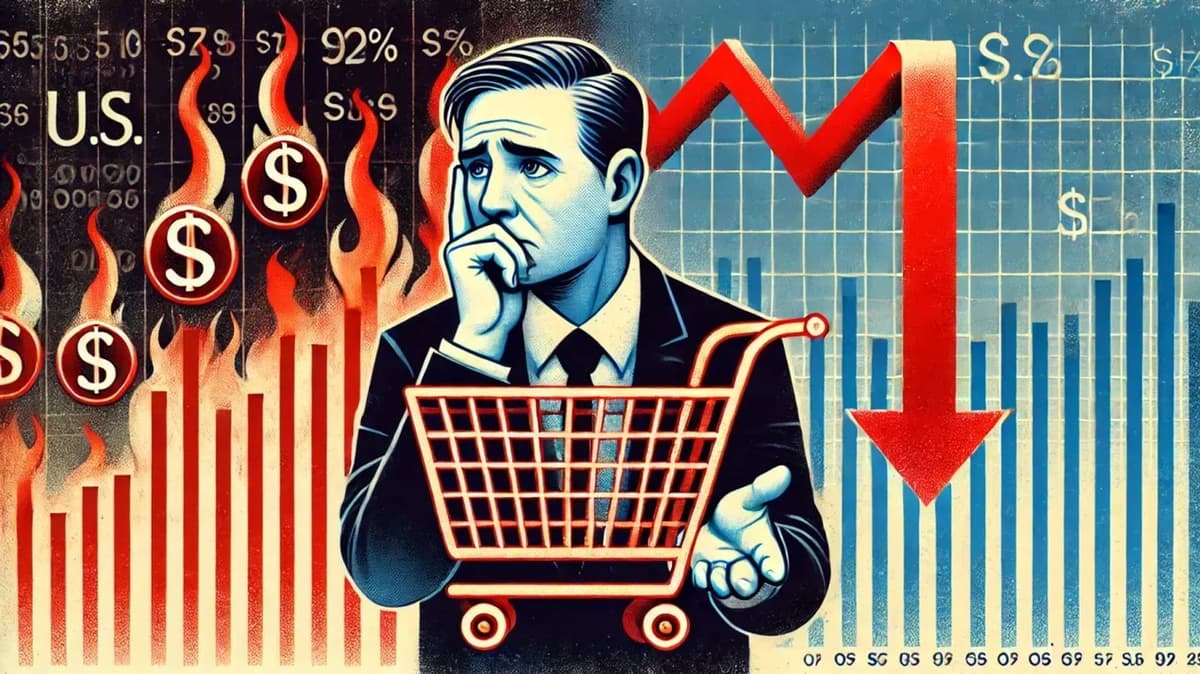
Gold prices fell because higher U.S. Treasury yields and a stronger U.S. dollar reduced demand for non-yielding precious metals. Those two macro forces remained the dominant market drivers in early Tuesday trade.
Spot gold was trading near $4,524.10 an ounce at the time of writing, down 0.90%. Spot silver was trading near $75.500, down 2.65%, with silver underperforming gold as broader macro pressure intensified.
The bond market remains central to the move. The 10-year U.S. Treasury yield held near the 4.6% area after Monday’s Treasury close at 4.61%, increasing the opportunity cost of holding gold, which does not offer a yield.
The U.S. dollar also added pressure. The dollar’s recovery toward the 100 area created a second headwind for internationally priced bullion, making gold and silver more expensive for holders of other currencies.
Why was silver weaker than gold?
Silver fell harder because silver carries a larger industrial beta than gold. That means silver often reacts more sharply when macro concerns, yields and growth-sensitive positioning hit the market at the same time.
While gold retained some safe-haven support, silver faced heavier downside pressure as traders responded to yield strength and dollar firmness.
How are Hormuz tensions affecting gold, oil and yields?
The Strait of Hormuz remains the key geopolitical variable because it influences energy prices, inflation expectations, bond yields and safe-haven demand. That creates a two-way impact on gold price action.
Oil prices pulled back after President Donald Trump paused a planned strike on Iran to allow more time for negotiations. Even so, the waterway remains effectively constrained, and crude oil is still trading above $100 a barrel.
That matters because geopolitical stress typically supports defensive demand for gold. At the same time, $100-plus WTI crude, Brent above $110 and rising gasoline inflation can keep bond yields elevated, which reduces the appeal of non-yielding assets such as gold.
What were oil prices doing?
Nymex WTI crude oil was softer and trading around $103.97 a barrel. Brent crude was near $111.15.
These elevated energy prices continue to feed inflation concerns across global markets. For Indian investors, sustained high crude prices can also pressure India’s import bill and the rupee, which may influence domestic gold prices even when international bullion weakens.
Which markets are showing the biggest Hormuz impact?
According to the market setup described in the Kitco AM Report, the clearest impact is visible in crude oil, gasoline, long-end Treasury yields, the U.S. dollar and pressure on rate-sensitive equities.
This mix is especially important for Indian gold buyers because it can create conflicting signals: safe-haven demand may support bullion, but higher yields and a stronger dollar can cap gains in XAUUSD.
What were global markets signaling on Tuesday?
Global market performance showed a mixed risk picture, with U.S. equity futures lower, Asian markets mixed and European markets firmer at midday. That backdrop suggested investors were still balancing geopolitical risk against interest-rate pressure.
Before the U.S. open, S&P 500 futures were down 0.3%, Dow futures were down 0.1% and Nasdaq futures were down 0.6%.
In Asia, Japan’s Nikkei 225 fell 0.4%, South Korea’s Kospi lost 3.3%, Australia’s S&P/ASX 200 gained 1.2%, Hong Kong’s Hang Seng rose 0.5% and the Shanghai Composite added 0.9%.
European markets were firmer at midday. France’s CAC 40 rose 0.8%, Germany’s DAX gained 1.4% and Britain’s FTSE 100 was up 0.6%.
What were traders watching next?
Traders were watching U.S. pending home sales due at 10 a.m. ET. Markets were also focused on any update on U.S.-Iran negotiations and tanker movements through the Gulf.
The key outside markets remained critical for gold and silver direction. The U.S. dollar index was firmer, and the benchmark 10-year U.S. Treasury note yield was trading near the 4.6% area.
What are the key gold price levels to watch now?

Gold’s near-term technical picture shows immediate resistance at $4,540.64 and support at $4,514.50. A decisive move beyond those levels could set the next directional trend for bullion.
Spot gold bulls’ next upside price objective is to push prices back above the $4,540.64 to $4,572 resistance zone. If gold sustains a move above that area, the next upside targets are $4,600 and then $4,629.
On the downside, bears’ next near-term price objective is a break below $4,514.50. If that support fails, deeper downside targets come in at $4,481.78 and then $4,400.
Gold support and resistance levels
- First resistance: $4,540.64
- Second resistance: $4,572
- Upside target above resistance zone: $4,600
- Further upside target: $4,629
- First support: $4,514.50
- Second support: $4,481.78
- Deeper downside target: $4,400
What are the key silver price levels to watch now?
Silver is testing a vulnerable area near $75, with support at $75.21 and $75.00 now in focus. If those levels break, the next downside target is $73.86.
Spot silver bulls’ next upside price objective is to drive prices back above the $76.28 to $77.56 area. A move above that resistance zone would target $78.00 and then $79.82.
On the downside, the next objective for silver bears is a break below $75.21. If selling intensifies, traders will watch $75.00 and then $73.86.
Silver support and resistance levels
- First resistance: $76.28
- Second resistance: $77.56
- Upside target above resistance zone: $78.00
- Further upside target: $79.82
- First support: $75.21
- Second support: $75.00
- Deeper downside target: $73.86